Journal:The cannabinoid content of legal cannabis in Washington State varies systematically across testing facilities and popular consumer products
| Full article title |
The cannabinoid content of legal cannabis in Washington State varies systematically across testing facilities and popular consumer products |
|---|---|
| Journal | Scientific Reports |
| Author(s) | Jikomes, Nick; Zoorob, Michael |
| Author affiliation(s) | Leafly Holdings, Harvard University |
| Primary contact | Email: Contact author via journal |
| Year published | 2018 |
| Volume and issue | 8 |
| Page(s) | 4519 |
| DOI | 10.1038/s41598-018-22755-2 |
| ISSN | 2045-2322 |
| Distribution license | Creative Commons Attribution 4.0 International |
| Website | https://www.nature.com/articles/s41598-018-22755-2 |
| Download | https://www.nature.com/articles/s41598-018-22755-2.pdf (PDF) |
|
|
This article contains rendered mathematical formulae. You may require the TeX All the Things plugin for Chrome or the Native MathML add-on and fonts for Firefox if they don't render properly for you. |
|
|
This article should not be considered complete until this message box has been removed. This is a work in progress. |
Abstract
The majority of adults in the U.S. now have state-legal access to medical or recreational cannabis products, despite their federal prohibition. Given the wide array of pharmacologically active compounds in these products, it is essential that their biochemical profile is measured and reported to consumers, which requires accurate laboratory testing. However, no universal standards for laboratory testing protocols currently exist, and there is controversy as to whether all reported results are legitimate. To investigate these concerns, we analyzed a publicly available seed-to-sale traceability dataset from Washington State containing measurements of the cannabinoid content of legal cannabis products from state-certified laboratories. Consistent with previous work, we found that commercial Cannabis strains fall into three broad chemotypes defined by the tetrahydrocannabinol:cannabidiol (THC:CBD) ratio. Moreover, we documented systematic differences in the cannabinoid content reported by different laboratories, relative stability in cannabinoid levels of commercial flower and concentrates over time, and differences between popular commercial strains. Importantly, interlab differences in cannabinoid reporting persisted even after controlling for plausible confounds. Our results underscore the need for standardized laboratory methodologies in the legal cannabis industry and provide a framework for quantitatively assessing laboratory quality.
Introduction
For millennia, Cannabis has been cultivated for medicinal, recreational, and industrial purposes.[1] Despite mounting evidence for the legitimate medical utility of cannabis products and their principal psychoactive constituents[2][3], they remain classified as Schedule I controlled substances by the U.S. federal government. Nonetheless, public opinion on legal cannabis has changed dramatically in recent years[4], and a majority of U.S. states now allow legal access to medical cannabis for approved patients, with several states also allowing recreational adult-use.[5][6] This dynamic legal landscape has given rise to a rapidly growing legal cannabis industry that offers a wide variety of products to consumers.
Because the core product of this burgeoning industry contains multiple compounds with psychoactive and medicinal properties[7], it is imperative that the major biochemical constituents of cannabis are accurately quantified, and the results made accessible to consumers. Because recreational cannabis products may differ substantially from cannabis grown for federally-sanctioned research[8] or found on the black market[9], there is a particular need to study the commercial cannabis being consumed today by millions of adults in states allowing legal adult-use consumption.
The adoption of universal industry testing standards will be crucial for comparing data across the many existing testing laboratories. However, standardized procedures have yet to be adopted, and controversy exists about whether all laboratories are accurately measuring and reporting cannabinoid content.[10] Most of these labs were not established quality control labs with a track record of testing food or pharmaceutical products, but rather started specifically to focus on cannabis products. At present, there is limited published data[8] on the content of commercial cannabis products in the U.S., including quantification of potential differences in the measurements reported across these testing laboratories. Reliable testing data will also shed light on questions important to consumers and regulators, such as whether cannabinoid levels are changing over time or differ systematically between commercial products.
To investigate these concerns, we analyzed a large dataset from Washington State’s seed-to-sale traceability system. This dataset comprises hundreds of thousands of measurements of the principal cannabinoids in commercial cannabis, including tetrahydrocannabinol (THC) and cannabidiol (CBD). These measurements are available for commercial products tested across all state-licensed laboratories since 2014, which allowed us to assess the cannabinoid composition of commercial products between laboratories, over time, and across strains.
Results
The basic chemotype landscape of commercial cannabis
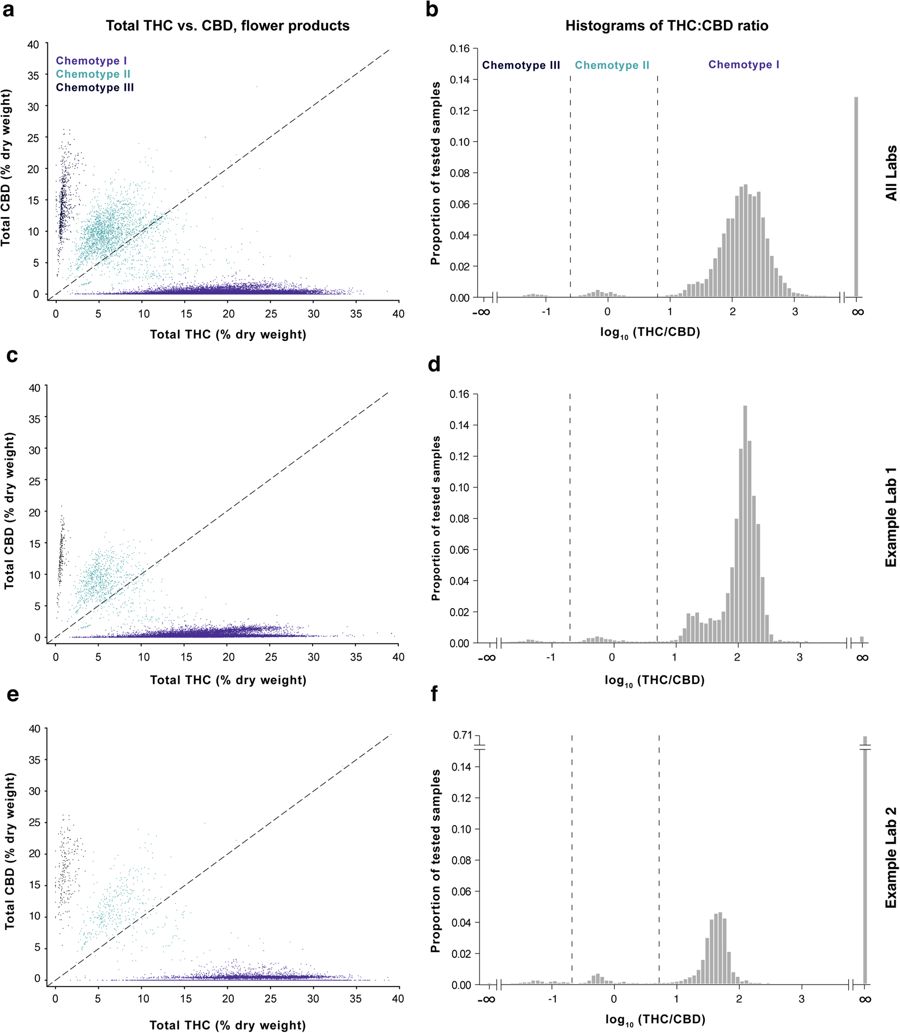
Cannabis likely evolved in Central Asia, and landraces native to regions including Afghanistan, Pakistan, India and China[11] have been found to fall into three general chemotypes based on genetically-constrained THC:CBD ratios.[12][13] Consistent with previous work in landraces and commercial Dutch Cannabis[13][14], we found that commercial Cannabis grown in Washington also conforms to this pattern (Fig. 1a–c). Unlike landraces, which are more likely to fall into the chemotype III (CBD-dominant) category and generally display lower overall levels of total THC[13], most commercial Cannabis falls into the chemotype I category, characterized by relatively high total THC and low total CBD levels (Fig. 1d–f; see "Methods" section at the end for definition of total THC and CBD levels). While studying the chemotype landscape of these commercial samples, we observed striking differences in THC:CBD distributions across laboratories for both flower (Fig. 1d–f, Figure S1) and concentrates (Figure S2). This prompted us to examine interlab differences in more detail. In particular, we wished to assess whether this variation stemmed from intrinsic (e.g., methodological) differences between laboratories or from heterogeneity in the products submitted to those labs.
|
THC and CBD measurements vary widely across testing laboratories
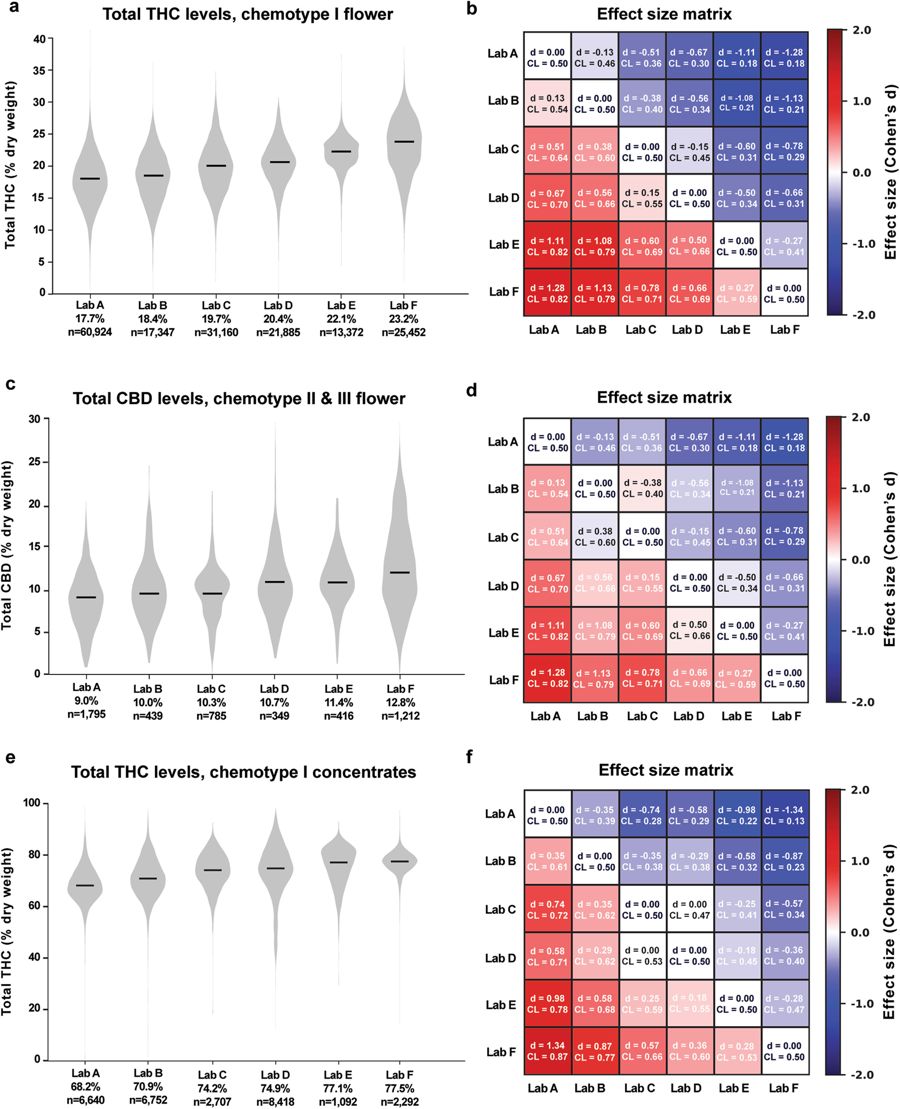
To compare cannabinoid measurements across labs, we looked at distributions of total THC and CBD levels for the six largest laboratories by data volume for different chemotypes and product categories. These labs, referred to henceforth as labs A-F, are Confidence Analytics (Lab A), Analytical 360 (Lab B), Green Grower Labs (Lab C), Integrity Labs (Lab D), Testing Technologies (Lab E), and Peak Analytics (Lab F). We observed differences in reported values of both THC and CBD (Fig. 2). For example, the median total THC content for chemotype I flower products ranged from 17.7% to 23.2% between the labs reporting the lowest and highest THC levels, respectively (Fig. 2a; labs A-F ordered from lowest to highest median reported THC levels). Pairwise differences in mean THC content between labs were statistically significant (p < 0.001 for each pairwise comparison in Fig. 2a, two-sided t-test). To quantify the magnitude of differences between labs, we calculated the effect sizes of pairwise differences using two metrics: Cohen’s d, the standardized difference between two means[15], and a “Common Language” (CL) effect size, the probability that a random value from one sample will be greater than a random value from the other[16] (Fig. 2b; see Analytical Methods).
|
Calculating effect sizes allows a more intuitive assessment of the magnitude of interlab differences, especially when very large sample sizes allow even trivial differences between means to reach statistical significance. For example, mean THC levels of the chemotype I flower for Lab B and Lab A were 18.4% and 17.7%, respectively (Fig. 2a and b). While this difference was highly significant due to the large sample sizes, the effect size was small (d = 0.13; see the "Methods" section). The common language effect size (CL) for this comparison was 0.54, indicating a 54% chance that a random THC measurement from Lab B will be larger than a random measurement from Lab A. In contrast, when comparing Lab F to Lab A, which reported the highest mean THC levels, the effect size was considerably larger (d = 1.28, CL = 0.82).
We observed a similar pattern when comparing CBD measurements across labs for chemotype II and III flower samples (Fig. 2c and d) and THC levels for concentrates (Fig. 2e and f). The labs reporting the highest levels of THC for chemotype I flower products also reported the highest levels of CBD for other flower chemotypes and THC levels for concentrates (Fig. 2), indicating a systematic tendency for certain labs to report higher levels of cannabinoids across chemotypes and product categories. This may be explained by differences in laboratory protocols. While most labs report using high-performance liquid chromatography (HPLC) to detect cannabinoids, the details of each protocol likely differ. Alternatively, interlab differences may be driven by labs receiving distinct sets of cannabis products for testing.
Interlab differences persist after controlling for plausible confounds
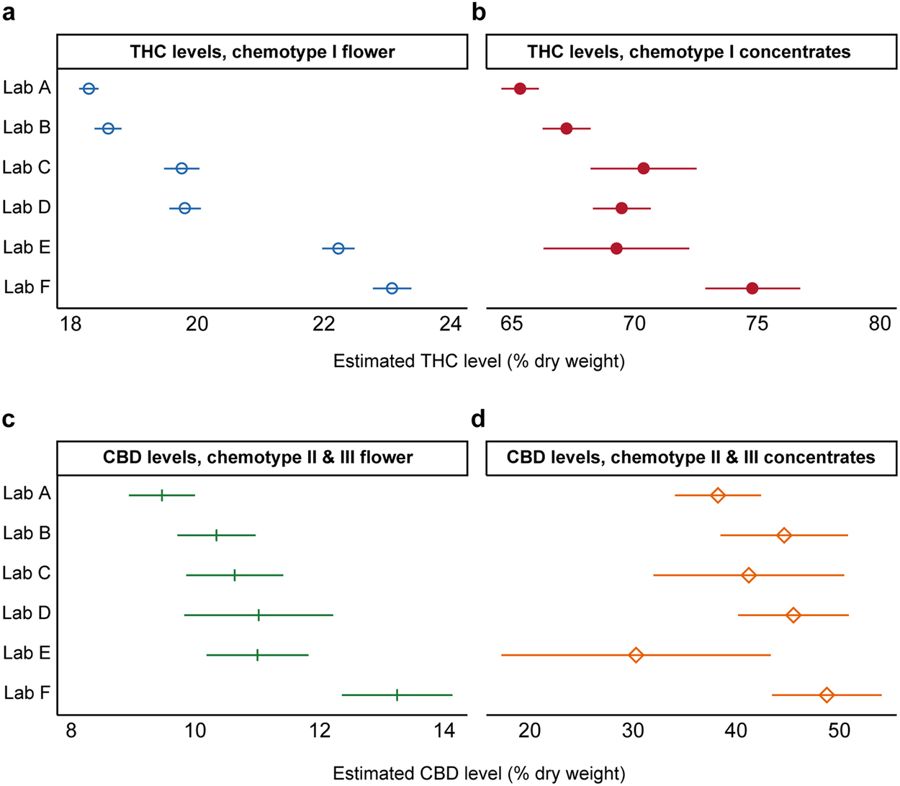
To investigate potential determinants of interlab differences, we quantified the average cannabinoid levels reported by each lab after accounting for strain name, the producer-processor submitting samples for testing, and time of measurement (see "Methods" section). Four separate regression models were estimated: (1) THC levels in chemotype I flower products (n = 161,933); (2) THC levels in chemotype I concentrate products (n = 33,888); (3) CBD levels in chemotype II and III flower products (n = 4,661); and (4) CBD levels in chemotype II and III concentrate products (n = 2,156). Large interlab variability in reported THC and CBD levels persisted across product categories after controlling for these factors (Fig. 3). Differences were observed for both flower (Fig. 3a,c) and concentrates (Fig. 3b,d). For chemotype I flower, the average adjusted total THC level for Peak Analytics (~23%) was significantly higher (p < 0.001; Wald test) than all other labs (Fig. 3a).
|
For chemotype I concentrates, Lab F’s average reported total THC (~75%) exceeded all other labs, including the lab reporting the second-highest average total THC (Lab E, ~70%). For total CBD levels in chemotype II and chemotype III flower, Lab F again reported the largest mean quantity, at about 13%, significantly higher (p < 0.01) than all other labs (Fig. 3c). For chemotype II and chemotype III concentrates, Lab F’s average products reported the highest CBD, but these estimates were uncertain due to the relatively small sample size (Fig. 3d). Overall, these results suggest that the observed differences between laboratories cannot be explained by differences in the producers, product types, or strain names of the samples being processed by each lab.
Low-level cannabinoid measurements vary widely across laboratories
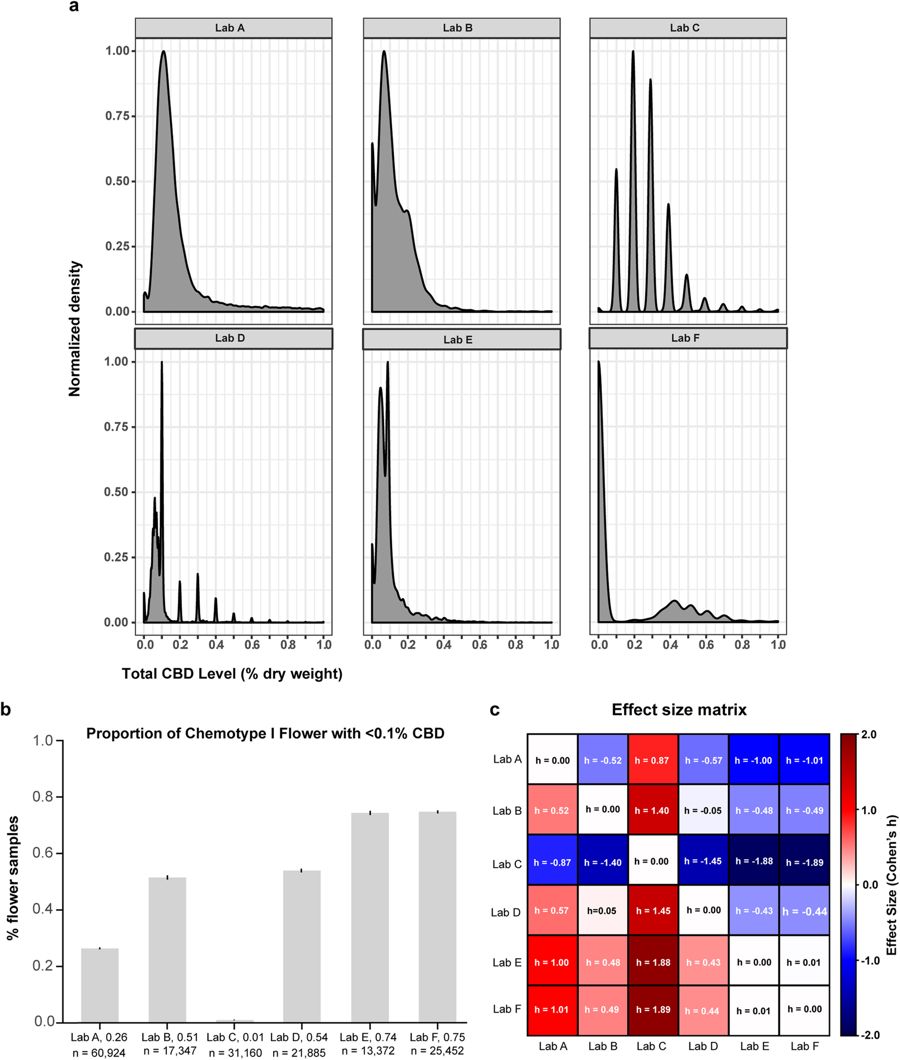
Examination of THC:CBD distributions across laboratories indicated substantial variation in their propensity to report chemotype I strains with low total CBD levels (Figure S1, far right bins). To investigate this further, we plotted the density of chemotype I flower products with less than 1% CBD by dry weight (Fig. 4). The shape of these distributions varied somewhat across labs, likely due to methodological differences determining their limit of quantification (LOQ). Similar to what we observed in the THC:CBD histograms (Fig. 1b), these density plots indicate that differences exist between labs’ propensity to detect low levels of CBD in chemotype I flower; they tend to display local maxima near 0.1%, which is the LOQ most labs report for cannabinoids.
|
To further quantify these differences, we compared the proportion of chemotype I flower having <0.1% total CBD across laboratories. There were dramatic differences between labs (Fig. 4b), with some reporting substantially more chemotype I flower with total CBD <0.1% than others. The volume of data caused even tiny interlab differences to reach high levels of statistical significance (p < 0.001 for all pairwise comparisons, except Lab E vs. Lab F, Mann-Whitney U test). Thus, we quantified the effect size of these differences by computing Cohen’s h for all pairwise comparisons (Fig. 4c; see Analytic Methods). Many of these interlab differences were of very large effect size (|h| >0.80, and often much greater), confirming that there are substantial differences in labs’ propensity to detect low levels of CBD in chemotype I flower. The analyses so far indicate that cannabinoid inflation and differences in the ability of labs to detect low-level cannabinoids both contribute to systematic differences in their reported measurements.
Changes in THC content of commercial cannabis products over time
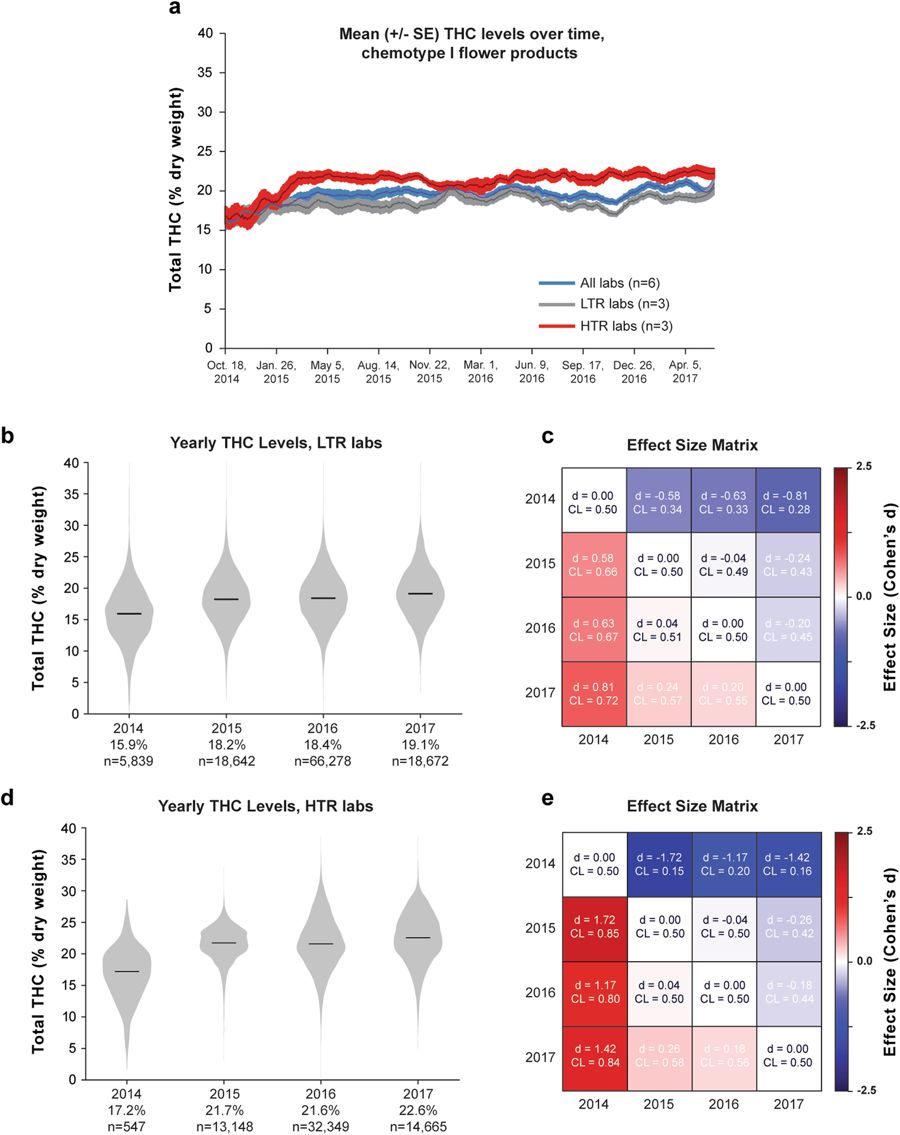
While modern commercial strains contain higher THC levels than recreational cannabis from past decades[17][18], it is unclear whether THC levels have continued climbing since Washington permitted adult-use cannabis. Thus, we looked for potential changes in the total THC content of commercial products in recent years. Because our previous analyses revealed systematic interlab variability in cannabinoid measurements, we sought to minimize the potential confound of lab-specific “cannabinoid inflation.” Thus, we quantified cannabinoid levels over time, separately for different subsets of laboratories: the three labs reporting the lowest mean THC levels (low THC reporting, LTR), the three reporting the highest mean THC levels (high THC reporting, HTR), as well as data pooled across laboratories. Figure 5a shows mean THC levels, averaged across labs, for chemotype I flower products from June 2014 through May 2017. While there was an upward trend from 2014 to early 2015, mean THC levels appear to have largely plateaued, with modest fluctuations since 2015 (Fig. 5a). This trend was evident in the pooled data as well as in LTR and HTR labs, although HTR labs showed a steeper increase in total THC levels from 2014 to 2015.
|
To further quantify changes in THC levels over time, we compared total THC levels for each year of data (Fig. 5b and c). Median THC levels for chemotype I flower rose from 2014 to 2015 but changed only slightly between 2015 and 2017. This was true whether we looked at the three LTR labs (Fig. 5b and c) or the three HTR labs (Fig. 5d and e). Again, large sample sizes allowed small differences in mean THC levels to reach statistical significance for all pairwise comparisons (p < 0.001, Mann-Whitney U test), except 2015 to 2016 for the HTR cohort (p = 0.334, Fig. 5d). After 2014, the effect sizes for year-to-year comparisons were small (Fig. 5b; |Cohen’s d| <0.23 for each comparison). Thus, we conclude that there has not been a substantial increase in the THC content of Washington state’s commercial cannabis flower from since 2015, although there were notable differences between LTR and HTR labs. For example, THC distributions from HTR labs were much more skewed (Fig. 5d; skew = −0.2) than for low-LTR labs (Fig. 5b; skew = 0.06). In addition, the increase in mean THC values from 2014 to 2015 was much larger for HTR than LTR labs (4.5% vs. 2.3%, respectively).
We were also interested in whether concentrates have increased in THC levels since 2014, as these products contain a much higher THC concentration. Mean THC levels across labs appeared to be relatively flat from 2014 to 2017 (Figure S3A). There was a small increase in THC levels from 2014 to 2015 for both cohorts of labs (Figure S3), although this was smaller than the increase observed for flower. From 2015 onward, there was a small decrease in mean THC levels for LTR and HTR labs (Figure S3). Thus, we conclude that, since 2015, there has not been a substantial increase in mean THC levels for commercial flower and concentrate products in Washington.
THC content across popular commercial categories: indica, sativa, and hybrid
The vernacular among cannabis users involves a triad of “indica,” “sativa,” and “hybrid” strains.[19][20] Recreational consumers and popular educational resources often attribute distinctive psychoactive effects to indica and sativa strains[21], while scholars tend to be more skeptical of these claims.[20] 22
In landraces, accessions from indica strains have been associated with more THC than sativas13 but indica and sativa recreational products sold in the Netherlands had similar THC content14. The term “strain,” although widely used, is not a botanically-accepted term for distinguishing plant varieties, and many scholars prefer the term “chemovar” in order to emphasize biochemical differences between specific Cannabis varieties23 (see Discussion). To investigate potential differences in cannabinoid content among commercial strain categories used by consumers, we looked at the distribution of THC content of indica, sativa, and hybrid flower samples in Washington’s commercial market. We matched test results using their producer-given strain name from the I-502 dataset to the Leafly.com strain database to retrieve their popular indica, sativa, or hybrid categorization (see Methods). This matching process yielded 166,594 flower results for analysis: 42,711 indica (25.6%), 31,822 sativa (19.1%), and 92,061 hybrid (55.3%) products. While hybrids had higher mean levels of THC compared to indicas and sativas, the distributions of THC content among indicas, sativas, and hybrids overlapped considerably (Fig. 6a–d).
References
- ↑ Grinspoon, L. (16 August 2005). "History of Cannabis as a Medicine" (PDF). MAPS. http://www.maps.org/research-archive/mmj/grinspoon_history_cannabis_medicine.pdf.
- ↑ Whiting, P.F.; Wolff, R.F.; Deshpande, S. et al. (2015). "Cannabinoids for Medical Use: A Systematic Review and meta-analysis". JAMA 313 (24): 2456–73. doi:10.1001/jama.2015.6358. PMID 26103030.
- ↑ National Academies of Sciences, Engineering, and Medicine (2017). The Health Effects of Cannabis and Cannabinoids: The Current State of Evidence and Recommendations for Research. National Academies Press. doi:10.17226/24625. ISBN 9780309453073.
- ↑ Geiger, A. (12 October 2016). "Support for marijuana legalization continues to rise". Fact Tank. Pew Research Center. http://www.pewresearch.org/fact-tank/2016/10/12/support-for-marijuana-legalization-continues-to-rise. Retrieved 29 September 2017.
- ↑ Compton, W.M.; Han, B.; Highes, A. et al. (2017). "Use of Marijuana for Medical Purposes Among Adults in the United States". JAMA 317 (2): 209–11. doi:10.1001/jama.2016.18900. PMID 27992636.
- ↑ Barry, R.A.; Glantz, S. (2016). "A Public Health Framework for Legalized Retail Marijuana Based on the US Experience: Avoiding a New Tobacco Industry". PLoS Medicine 13 (9): e1002131. doi:10.1371/journal.pmed.1002131. PMC PMC5038957. PMID 27676176. http://www.pubmedcentral.nih.gov/articlerender.fcgi?tool=pmcentrez&artid=PMC5038957.
- ↑ Andre, C.M.; Hausman, J.-F.; Guerriero, G. (2016). "Cannabis sativa: The plant of the thousand and one molecules". Frontiers in Plant Medicine 7: 19. doi:10.3389/fpls.2016.00019. PMC PMC4740396. PMID 26870049. http://www.pubmedcentral.nih.gov/articlerender.fcgi?tool=pmcentrez&artid=PMC4740396.
- ↑ 8.0 8.1 Vergara, D.; Bidwell, L.C.; Gaudino, R. et al. (2017). "Compromised External Validity: Federally Produced Cannabis Does Not Reflect Legal Markets". Scientific Reports 7: 46528. doi:10.1038/srep46528. PMC PMC5395929. PMID 28422145. http://www.pubmedcentral.nih.gov/articlerender.fcgi?tool=pmcentrez&artid=PMC5395929.
- ↑ Morgan, C.J.; Schafer, G.; Freeman, T.P. et al. (2010). "Impact of cannabidiol on the acute memory and psychotomimetic effects of smoked cannabis: Naturalistic study". The British Journal of Psychiatry 197: 4. doi:10.1192/bjp.bp.110.077503. PMID 20884951.
- ↑ Coughlin-Bogue, T. (28 April 2017). "Leafly Investigation: Is Washington's Top Cannabis Lab Inflating THC Numbers?". Leafly. https://www.leafly.com/news/industry/leafly-investigation-washingtons-top-cannabis-lab-inflating-thc-numbers. Retrieved 13 September 2017.
- ↑ Hillig, K.W. (2005). "Genetic evidence for speciation in Cannabis (Cannabaceae)". Genetic Resources and Crop Evolution 52 (2): 161–80. doi:10.1007/s10722-003-4452-y.
- ↑ de Meijer, E.P.; Bagatta, M.; Carboni, A. et al. (2003). "The inheritance of chemical phenotype in Cannabis sativa L". Genetics 163 (1): 335–46. PMC PMC1462421. PMID 12586720. http://www.pubmedcentral.nih.gov/articlerender.fcgi?tool=pmcentrez&artid=PMC1462421.
- ↑ 13.0 13.1 13.2 Hillig, K.W.; Mahlberg, P.G. (2004). "A chemotaxonomic analysis of cannabinoid variation in Cannabis (Cannabaceae)". American Journal of Botany 91 (6): 966-75. doi:10.3732/ajb.91.6.966. PMID 21653452.
- ↑ Hazekamp, A.; Tejkalová, K.; Papadimitriou, S. (2016). "Cannabis: From Cultivar to Chemovar II—A Metabolomics Approach to Cannabis Classification". Cannabis and Cannabinoid Research 1 (1). doi:10.1089/can.2016.0017.
- ↑ Cohen, J. (1988). Statistical power analysis for the behavioral sciences (2nd ed.). L. Eribaum Associates. ISBN 9780805802832.
- ↑ McGraw, K.O.; Wong, S.P. (1992). "A common language effect size statistic". Psychological Bulletin 111 (2): 361–65. doi:10.1037/0033-2909.111.2.361.
- ↑ ElSohly, M.A.; Mehmedic, Z.; Foster, S. et al. (2016). "Changes in Cannabis Potency Over the Last 2 Decades (1995-2014): Analysis of Current Data in the United States". Biological Psychiatry 79 (7): 613–9. doi:10.1016/j.biopsych.2016.01.004. PMC PMC4987131. PMID 26903403. http://www.pubmedcentral.nih.gov/articlerender.fcgi?tool=pmcentrez&artid=PMC4987131.
- ↑ Mehmedic, Z.; Chandra, S.; Slade, D. et al. (2010). "Potency trends of Δ9-THC and other cannabinoids in confiscated cannabis preparations from 1993 to 2008". Journal of Forensic Sciences 55 (5): 1209–17. doi:10.1111/j.1556-4029.2010.01441.x. PMID 20487147.
- ↑ Cervantes, J. (2015). The Cannabis Encyclopedia: The Definitive Guide to Cultivation & Consumption of Medical Marijuana. Van Patten Publishing. ISBN 9781878823342.
- ↑ 20.0 20.1 McPartland, J.M. (2017). "Cannabis sativa and Cannabis indica versus “Sativa” and “Indica”". In Chandra, S.; Lata, H.; ElSholy, M.A.. Cannabis sativa L. - Botany and Biotechnology. Springer. pp. 101–21. ISBN 9783319545646.
- ↑ Pearce, D.D.; Mitsouras, K.; Irizarry, K.J. (2014). "Discriminating the effects of Cannabis sativa and Cannabis indica: A web survey of medical cannabis users". Journal of Alternative 20 (10): 787–91. doi:10.1089/acm.2013.0190. PMID 25191852.
Notes
This presentation is faithful to the original, with only a few minor changes to presentation. Some grammar and punctuation was cleaned up to improve readability. In some cases important information was missing from the references, and that information was added.
