File:Fig5 Feder FrontPlantSci2021 12.jpg
Original file (4,606 × 3,134 pixels, file size: 813 KB, MIME type: image/jpeg)
Summary
| Description |
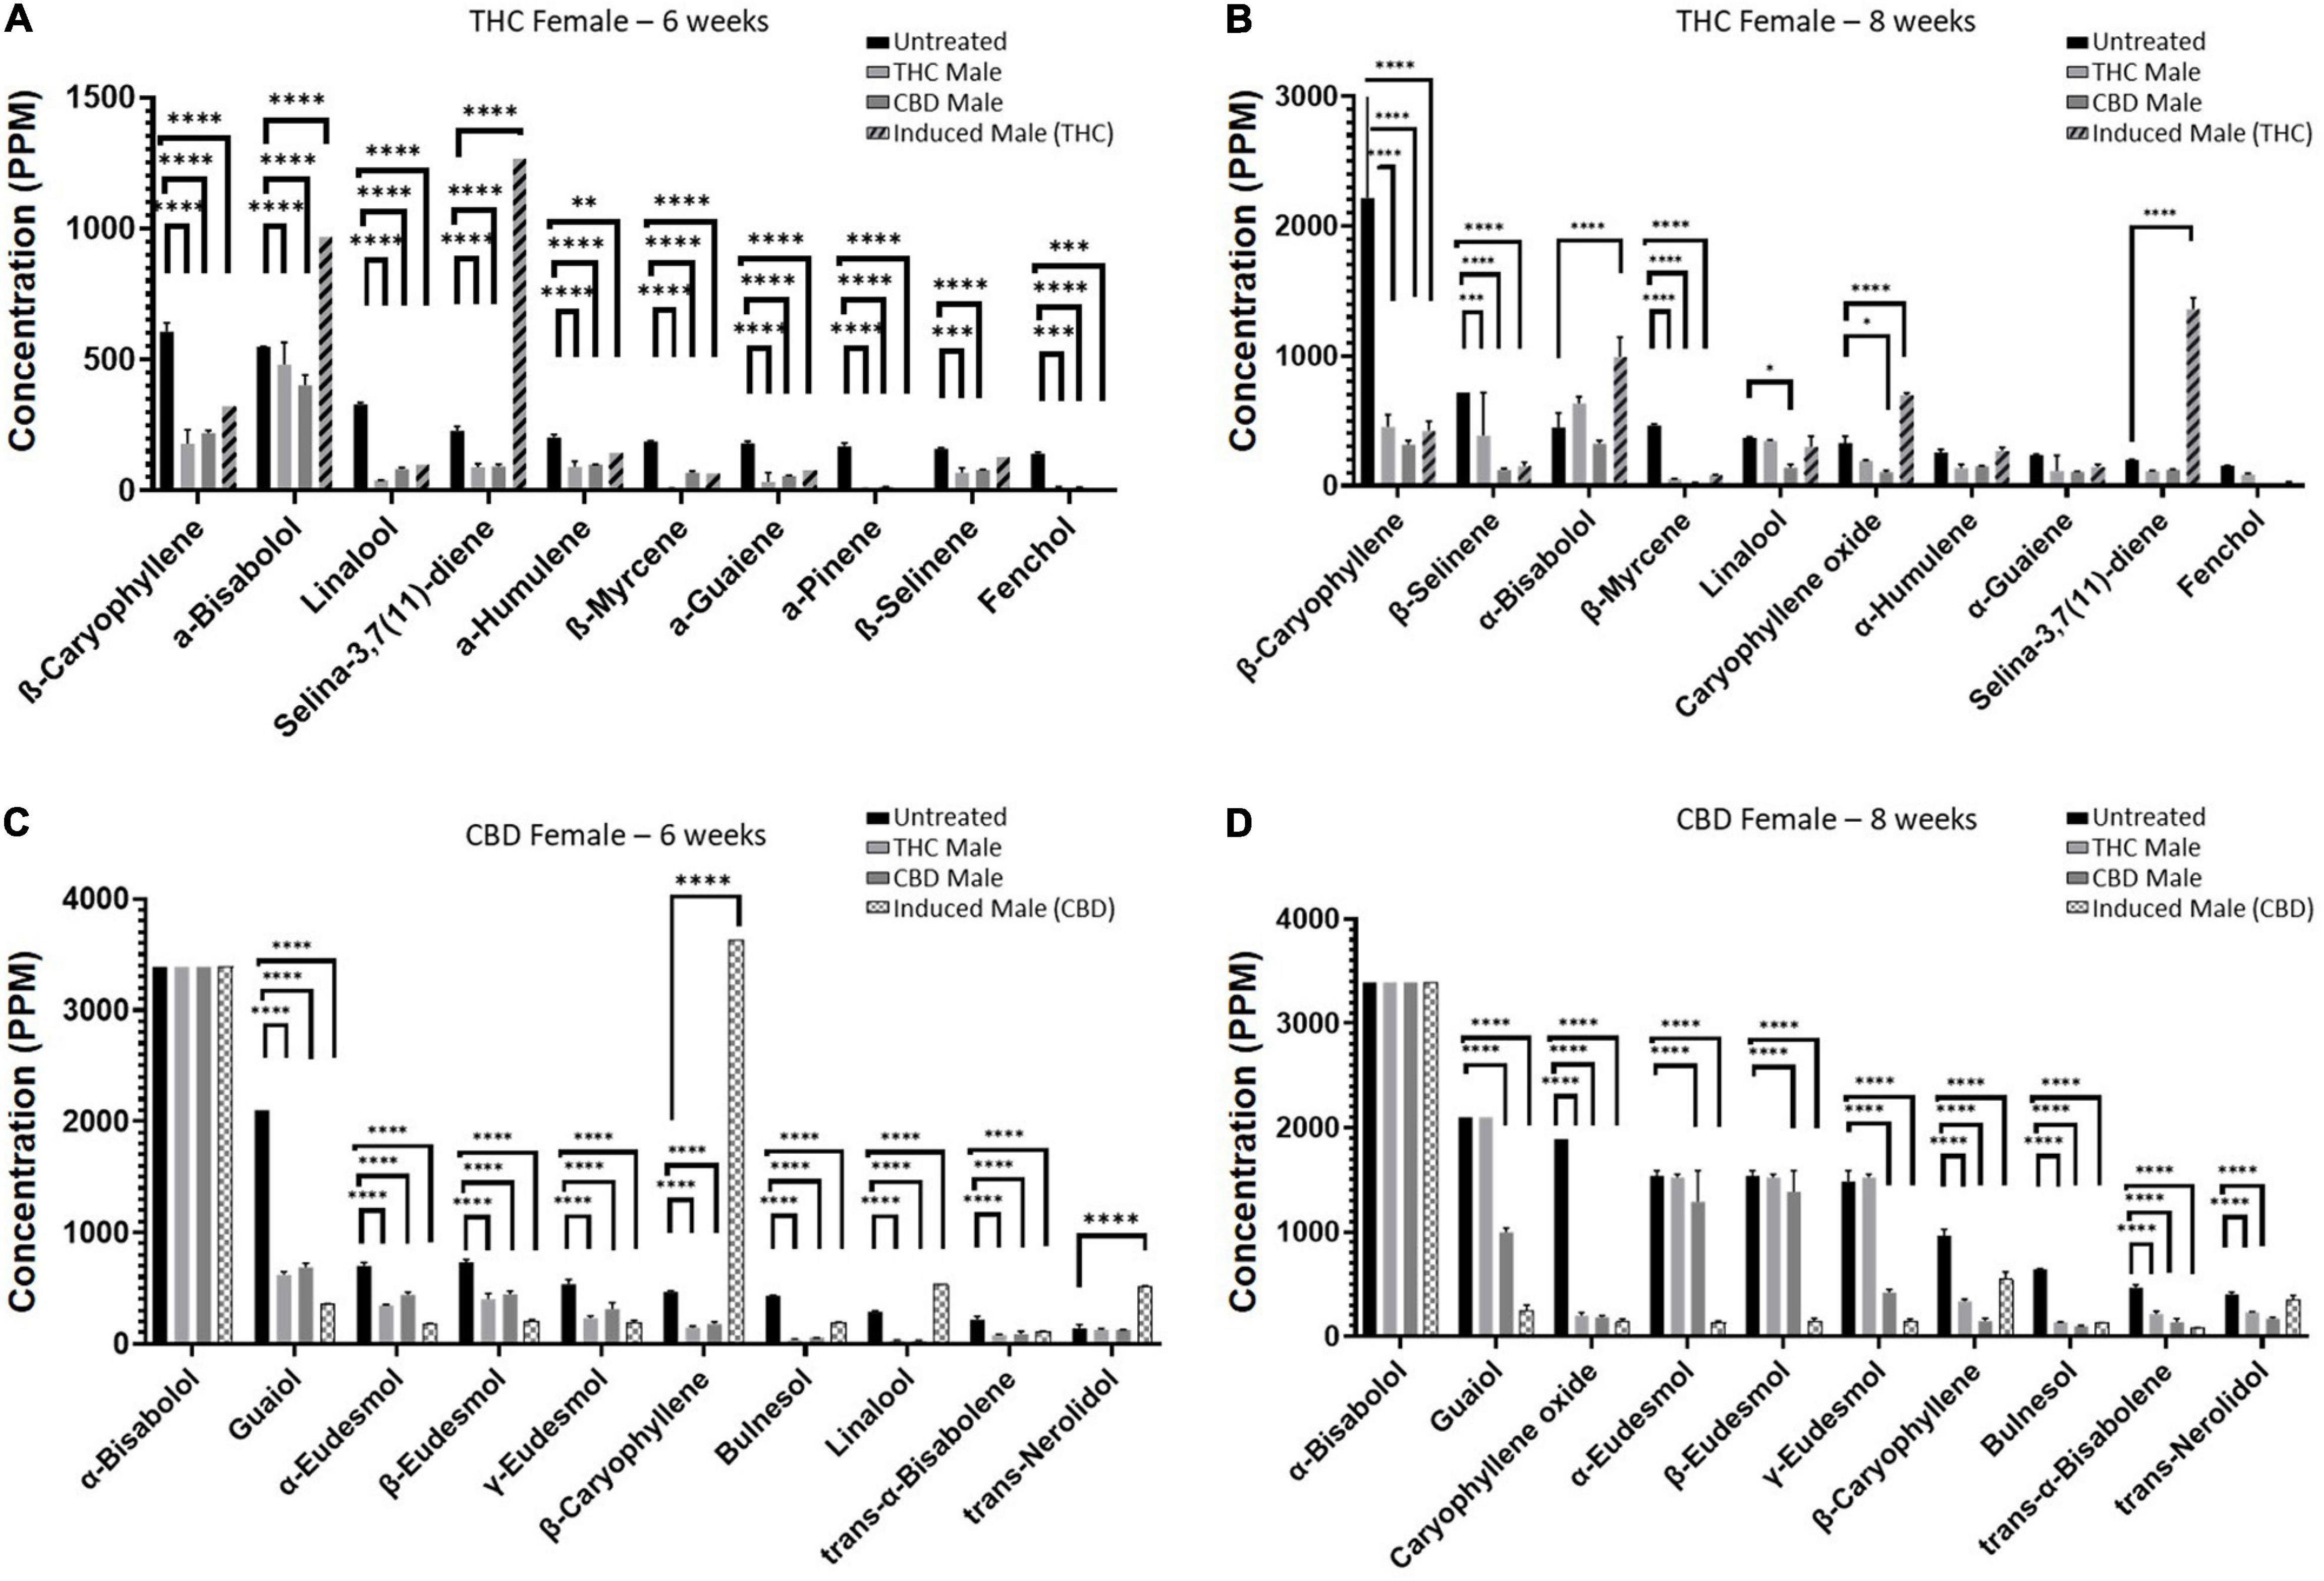
Fig. 5 Individual terpenoid concentrations in THC- and CBD-rich female plants at six or eight weeks. Abundant terpenoids in the unfertilized female flowers and their concentrations at six weeks (A, C) and eight weeks (B, D). Data are reported as mean ± SEM of terpenoid concentration (n = 2–3, except THC-female fertilized by induced male (THC) at six weeks). Statistically significant differences between treatments and control (unfertilized) were calculated by two-way ANOVA, followed by Dunnett’s multiple comparison test (*p ≤ 0.05; **p ≤ 0.01; ***p ≤ 0.001; ****p ≤ 0.0001). Values presented without SEM exceeded the maximal detection limit (maximum limits of detection for terpenoids appear in Supplementary material, Table 5). |
|---|---|
| Source |
Feder, C.L.; Cohen, O.; Shapira, A.; Katzir, I.; Peer, R.; Guberman, O.; Procaccia, S.; Berman, P.; Flaishman, M.; Meiri, D. (2021). "Fertilization following pollination predominantly decreases phytocannabinoids accumulation and alters the accumulation of terpenoids in Cannabis inflorescences". Frontiers in Plant Science 12: 753847. doi:10.3389/fpls.2021.753847. |
| Date |
2021 |
| Author |
Feder, C.L.; Cohen, O.; Shapira, A.; Katzir, I.; Peer, R.; Guberman, O.; Procaccia, S.; Berman, P.; Flaishman, M.; Meiri, D. |
| Permission (Reusing this file) |
|
| Other versions |
Licensing
|
|
This work is licensed under the Creative Commons Attribution 4.0 License. |
File history
Click on a date/time to view the file as it appeared at that time.
| Date/Time | Thumbnail | Dimensions | User | Comment | |
|---|---|---|---|---|---|
| current | 22:05, 29 November 2021 | | 4,606 × 3,134 (813 KB) | Shawndouglas (talk | contribs) |
You cannot overwrite this file.