File:Fig4 Wylie MedCannCannab2020 3-1.jpg
Original file (896 × 959 pixels, file size: 262 KB, MIME type: image/jpeg)
Summary
| Description |
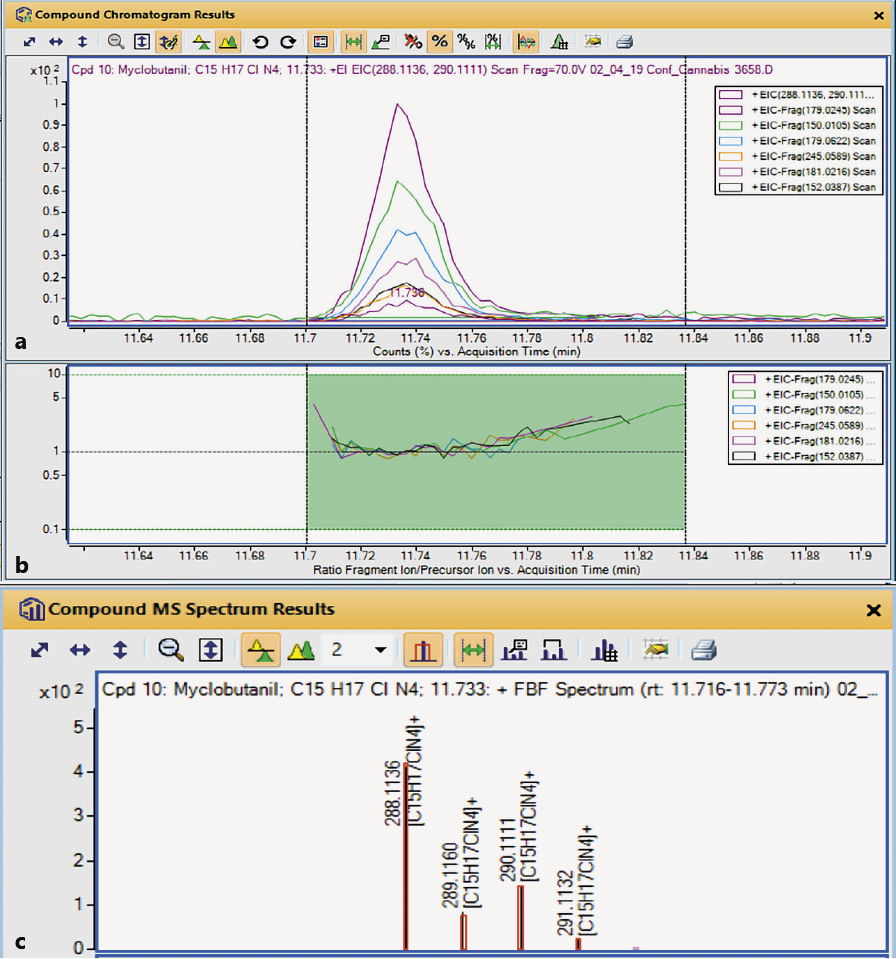
Fig. 4 a. Overlaid chromatograms of the six ions extracted for myclobutanil. b. A coelution plot showing the abundance of each ion over the full peak width. The EIC responses are normalized to the reference ion response. If each EIC had the identical relative peak shape, the plot would show a horizontal straight line. c. The isotope pattern of the molecular ion (black vertical lines) compared to the theoretical pattern (red boxes). |
|---|---|
| Source |
Wylie, P.L.; Westland, J.; Wang, M.; Radwan, M.M.; Majumdat, C.G.; ElSohly, M.A. (2020). "Screening for more than 1,000 pesticides and environmental contaminants in cannabis by GC/Q-TOF". Medical Cannabis and Cannabinoids 3 (1): 14–24. doi:10.1159/000504391. |
| Date |
2020 |
| Author |
Wylie, P.L.; Westland, J.; Wang, M.; Radwan, M.M.; Majumdat, C.G.; ElSohly, M.A. |
| Permission (Reusing this file) |
Creative Commons Attribution-NonCommercial-NoDerivatives 4.0 International |
| Other versions |
Licensing
|
|
This work is licensed under the Creative Commons Attribution-NonCommercial-NoDerivatives 4.0 International License. |
File history
Click on a date/time to view the file as it appeared at that time.
| Date/Time | Thumbnail | Dimensions | User | Comment | |
|---|---|---|---|---|---|
| current | 16:54, 20 September 2020 | | 896 × 959 (262 KB) | Shawndouglas (talk | contribs) |
You cannot overwrite this file.
File usage
The following page uses this file: