File:Fig4 Feder FrontPlantSci2021 12.jpg
Original file (4,550 × 1,178 pixels, file size: 285 KB, MIME type: image/jpeg)
Summary
| Description |
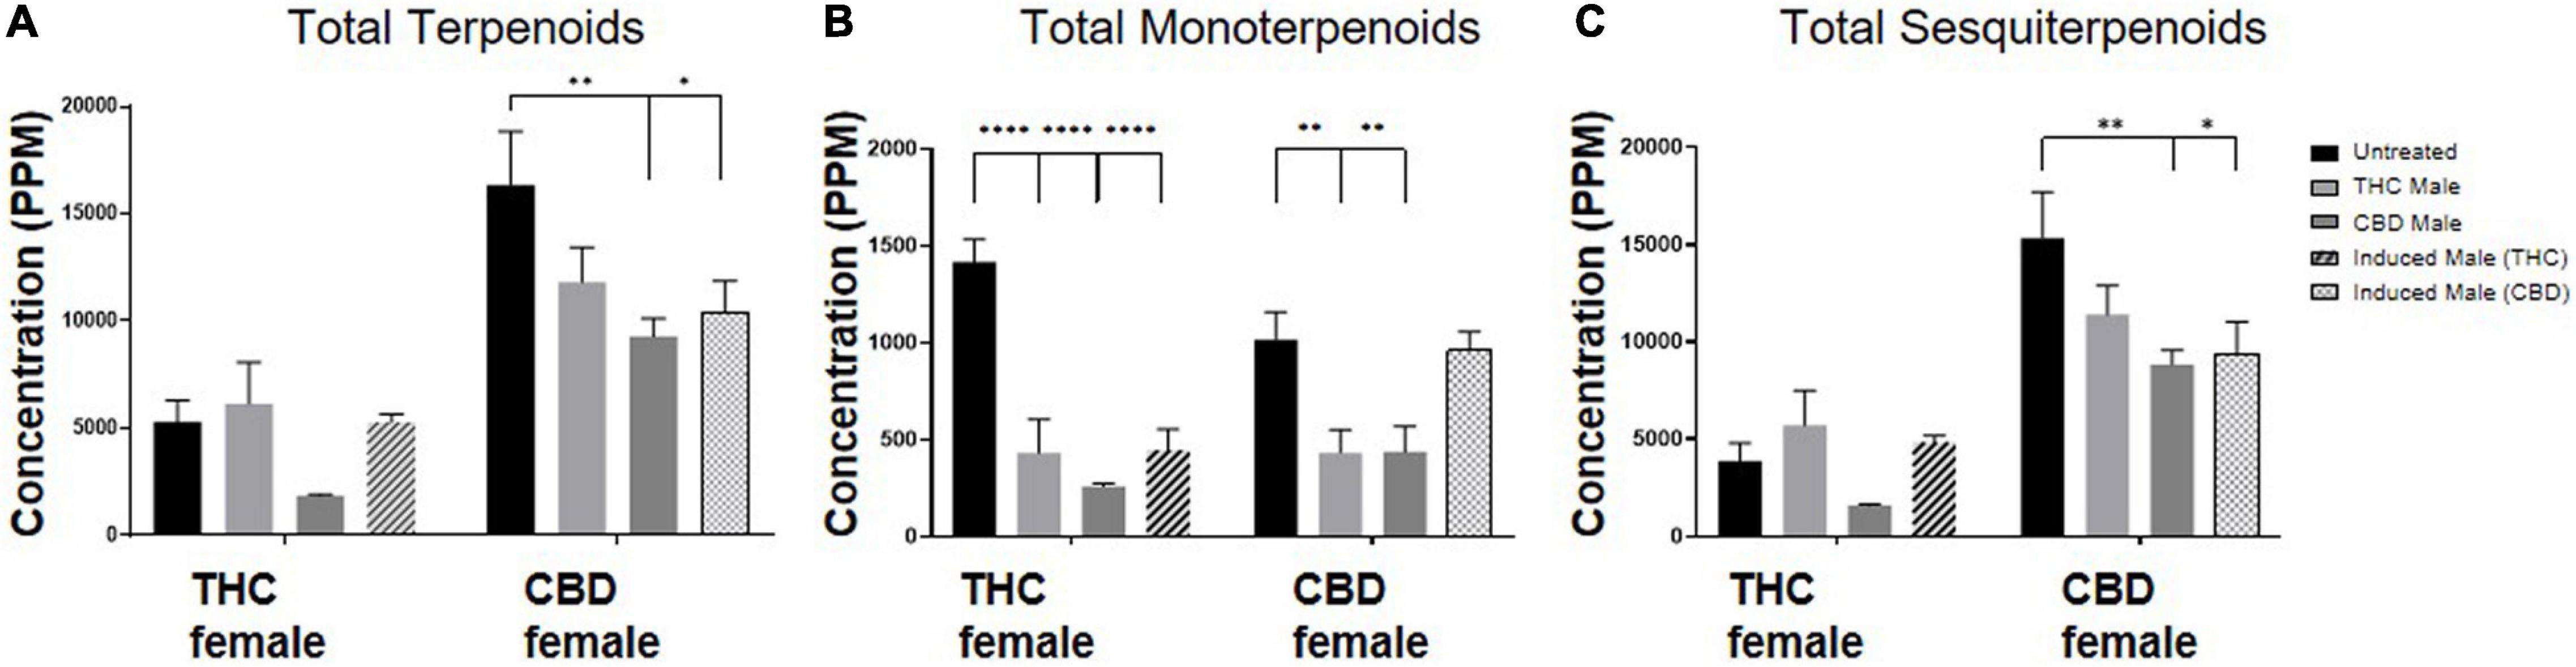
Fig. 4 Terpenoid quantity varies after fertilization. Terpenoid concentrations as quantified by SHS-GC/MS/MS of (A) total identified terpenoids, (B) total monoterpenoids and (C) total sesquiterpenoids. Data are reported as mean ± SEM of terpenoid concentrations (n = 3–4, ppm). Statistically significant differences between treatments and control (unfertilized) were calculated by two-way ANOVA followed by Dunnett’s multiple comparison test (*p ≤ 0.05; **p ≤ 0.01; ****p ≤ 0.0001). |
|---|---|
| Source |
Feder, C.L.; Cohen, O.; Shapira, A.; Katzir, I.; Peer, R.; Guberman, O.; Procaccia, S.; Berman, P.; Flaishman, M.; Meiri, D. (2021). "Fertilization following pollination predominantly decreases phytocannabinoids accumulation and alters the accumulation of terpenoids in Cannabis inflorescences". Frontiers in Plant Science 12: 753847. doi:10.3389/fpls.2021.753847. |
| Date |
2021 |
| Author |
Feder, C.L.; Cohen, O.; Shapira, A.; Katzir, I.; Peer, R.; Guberman, O.; Procaccia, S.; Berman, P.; Flaishman, M.; Meiri, D. |
| Permission (Reusing this file) |
|
| Other versions |
Licensing
|
|
This work is licensed under the Creative Commons Attribution 4.0 License. |
File history
Click on a date/time to view the file as it appeared at that time.
| Date/Time | Thumbnail | Dimensions | User | Comment | |
|---|---|---|---|---|---|
| current | 21:51, 29 November 2021 | 4,550 × 1,178 (285 KB) | Shawndouglas (talk | contribs) |
You cannot overwrite this file.