Difference between revisions of "File:Fig3 Mudge ScientificReports2018 8.png"
From CannaQAWiki
Jump to navigationJump to searchShawndouglas (talk | contribs) |
Shawndouglas (talk | contribs) (Added summary) |
||
| Line 1: | Line 1: | ||
==Summary== | |||
{{Information | |||
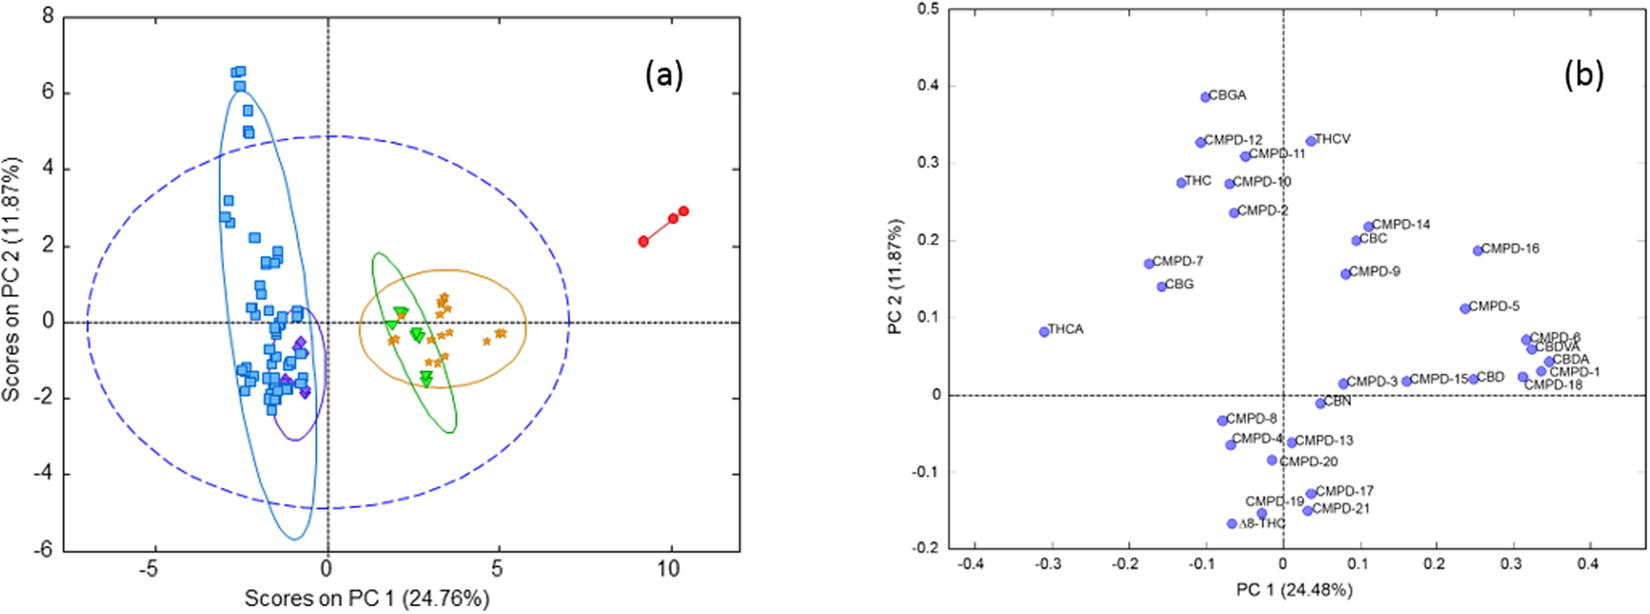
|Description='''Figure 3.''' Principal Component Analysis (PCA) of cannabinoid profiles classified according to THC/CBD contents ('''a''') scores plot ('''b''') loadings plot. |Source={{cite journal |title=Chemometric analysis of cannabinoids: Chemotaxonomy and domestication syndrome |journal=Scientific Reports |author=Mudge, E.M.; Murch, S.J.; Brown, P.N. |volume=8 |pages=13090 |year=2018 |doi=10.1038/s41598-018-31120-2}} | |||
|Author=Matielo, C.B.D.; Sarzi, D.S.; Justolin, B.; Lemos, R.P.M.; Camargo, F.A.O.; Stefenon, V.M. | |||
|Date=2018 | |||
|Permission=[https://creativecommons.org/licenses/by/4.0/ Creative Commons Attribution 4.0 International] | |||
}} | |||
== Licensing == | == Licensing == | ||
{{cc-by-4.0}} | {{cc-by-4.0}} | ||
Latest revision as of 20:51, 28 May 2019
Summary
| Description |
Figure 3. Principal Component Analysis (PCA) of cannabinoid profiles classified according to THC/CBD contents (a) scores plot (b) loadings plot. |
|---|---|
| Source |
Mudge, E.M.; Murch, S.J.; Brown, P.N. (2018). "Chemometric analysis of cannabinoids: Chemotaxonomy and domestication syndrome". Scientific Reports 8: 13090. doi:10.1038/s41598-018-31120-2. |
| Date |
2018 |
| Author |
Matielo, C.B.D.; Sarzi, D.S.; Justolin, B.; Lemos, R.P.M.; Camargo, F.A.O.; Stefenon, V.M. |
| Permission (Reusing this file) |
|
| Other versions |
Licensing
|
|
This work is licensed under the Creative Commons Attribution 4.0 License. |
File history
Click on a date/time to view the file as it appeared at that time.
| Date/Time | Thumbnail | Dimensions | User | Comment | |
|---|---|---|---|---|---|
| current | 20:49, 28 May 2019 | 1,650 × 614 (211 KB) | Shawndouglas (talk | contribs) |
You cannot overwrite this file.
File usage
The following page uses this file: