File:Fig3 Hall TalantaOpen2022 5.jpg
Original file (3,583 × 1,929 pixels, file size: 292 KB, MIME type: image/jpeg)
Summary
| Description |
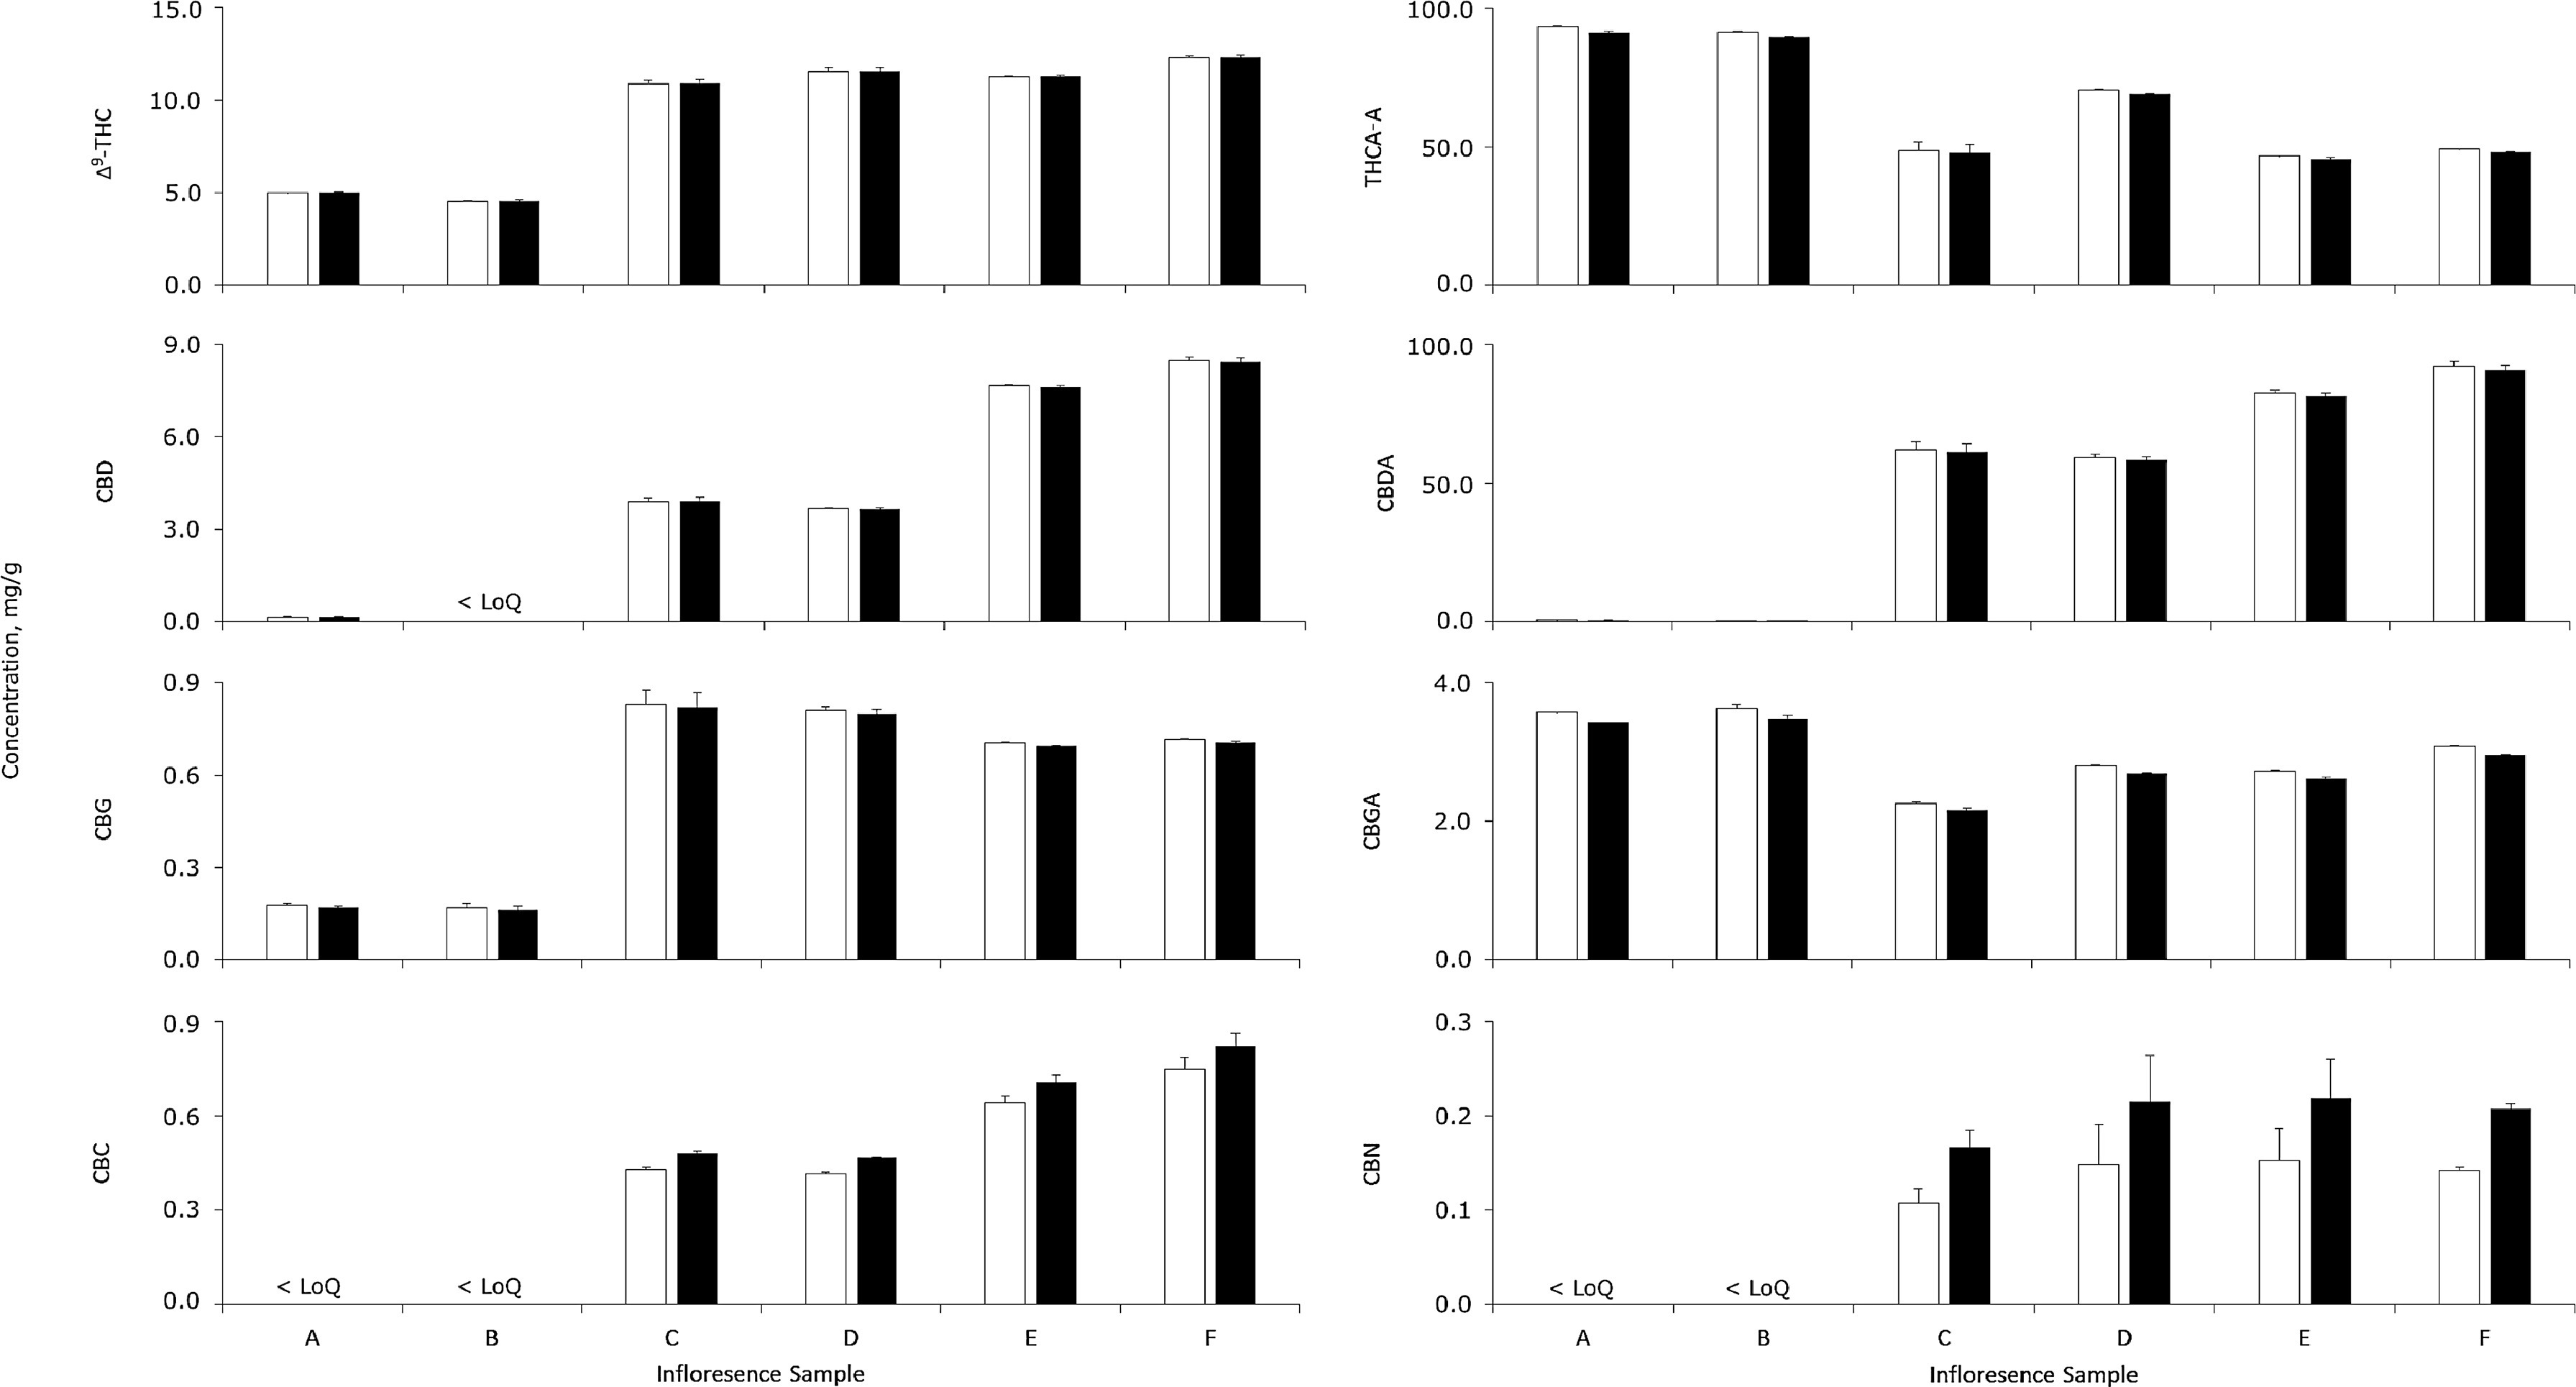
Fig. 3 Cannabinoid concentrations for inflorescence samples A to F, as reported by the multipoint calibration (white) against the RRF calibration (black); mean ± sample standard deviation (n = 2 × 2, sample preparations × injections). No sample contained detectable amounts of Δ8-THC or CBDV. |
|---|---|
| Source |
Hall, D.R.; Sinclair, J.S.; Bhuyan, D.J.; Khoo, C.; Li, C.G.; Sarris, J.; Low, M. (2022). "Quality control of cannabis inflorescence and oil products: Response factors for the cost-efficient determination of ten cannabinoids by HPLC". Talanta Open 5: 100112. doi:10.1016/j.talo.2022.100112. |
| Date |
2022 |
| Author |
Hall, D.R.; Sinclair, J.S.; Bhuyan, D.J.; Khoo, C.; Li, C.G.; Sarris, J.; Low, M. |
| Permission (Reusing this file) |
|
| Other versions |
Licensing
|
|
This work is licensed under the Creative Commons Attribution 4.0 License. |
File history
Click on a date/time to view the file as it appeared at that time.
| Date/Time | Thumbnail | Dimensions | User | Comment | |
|---|---|---|---|---|---|
| current | 19:01, 13 December 2022 | | 3,583 × 1,929 (292 KB) | Shawndouglas (talk | contribs) |
You cannot overwrite this file.
File usage
The following page uses this file: