File:Fig3 Eržen Plants21 10-5.png
From CannaQAWiki
Jump to navigationJump to search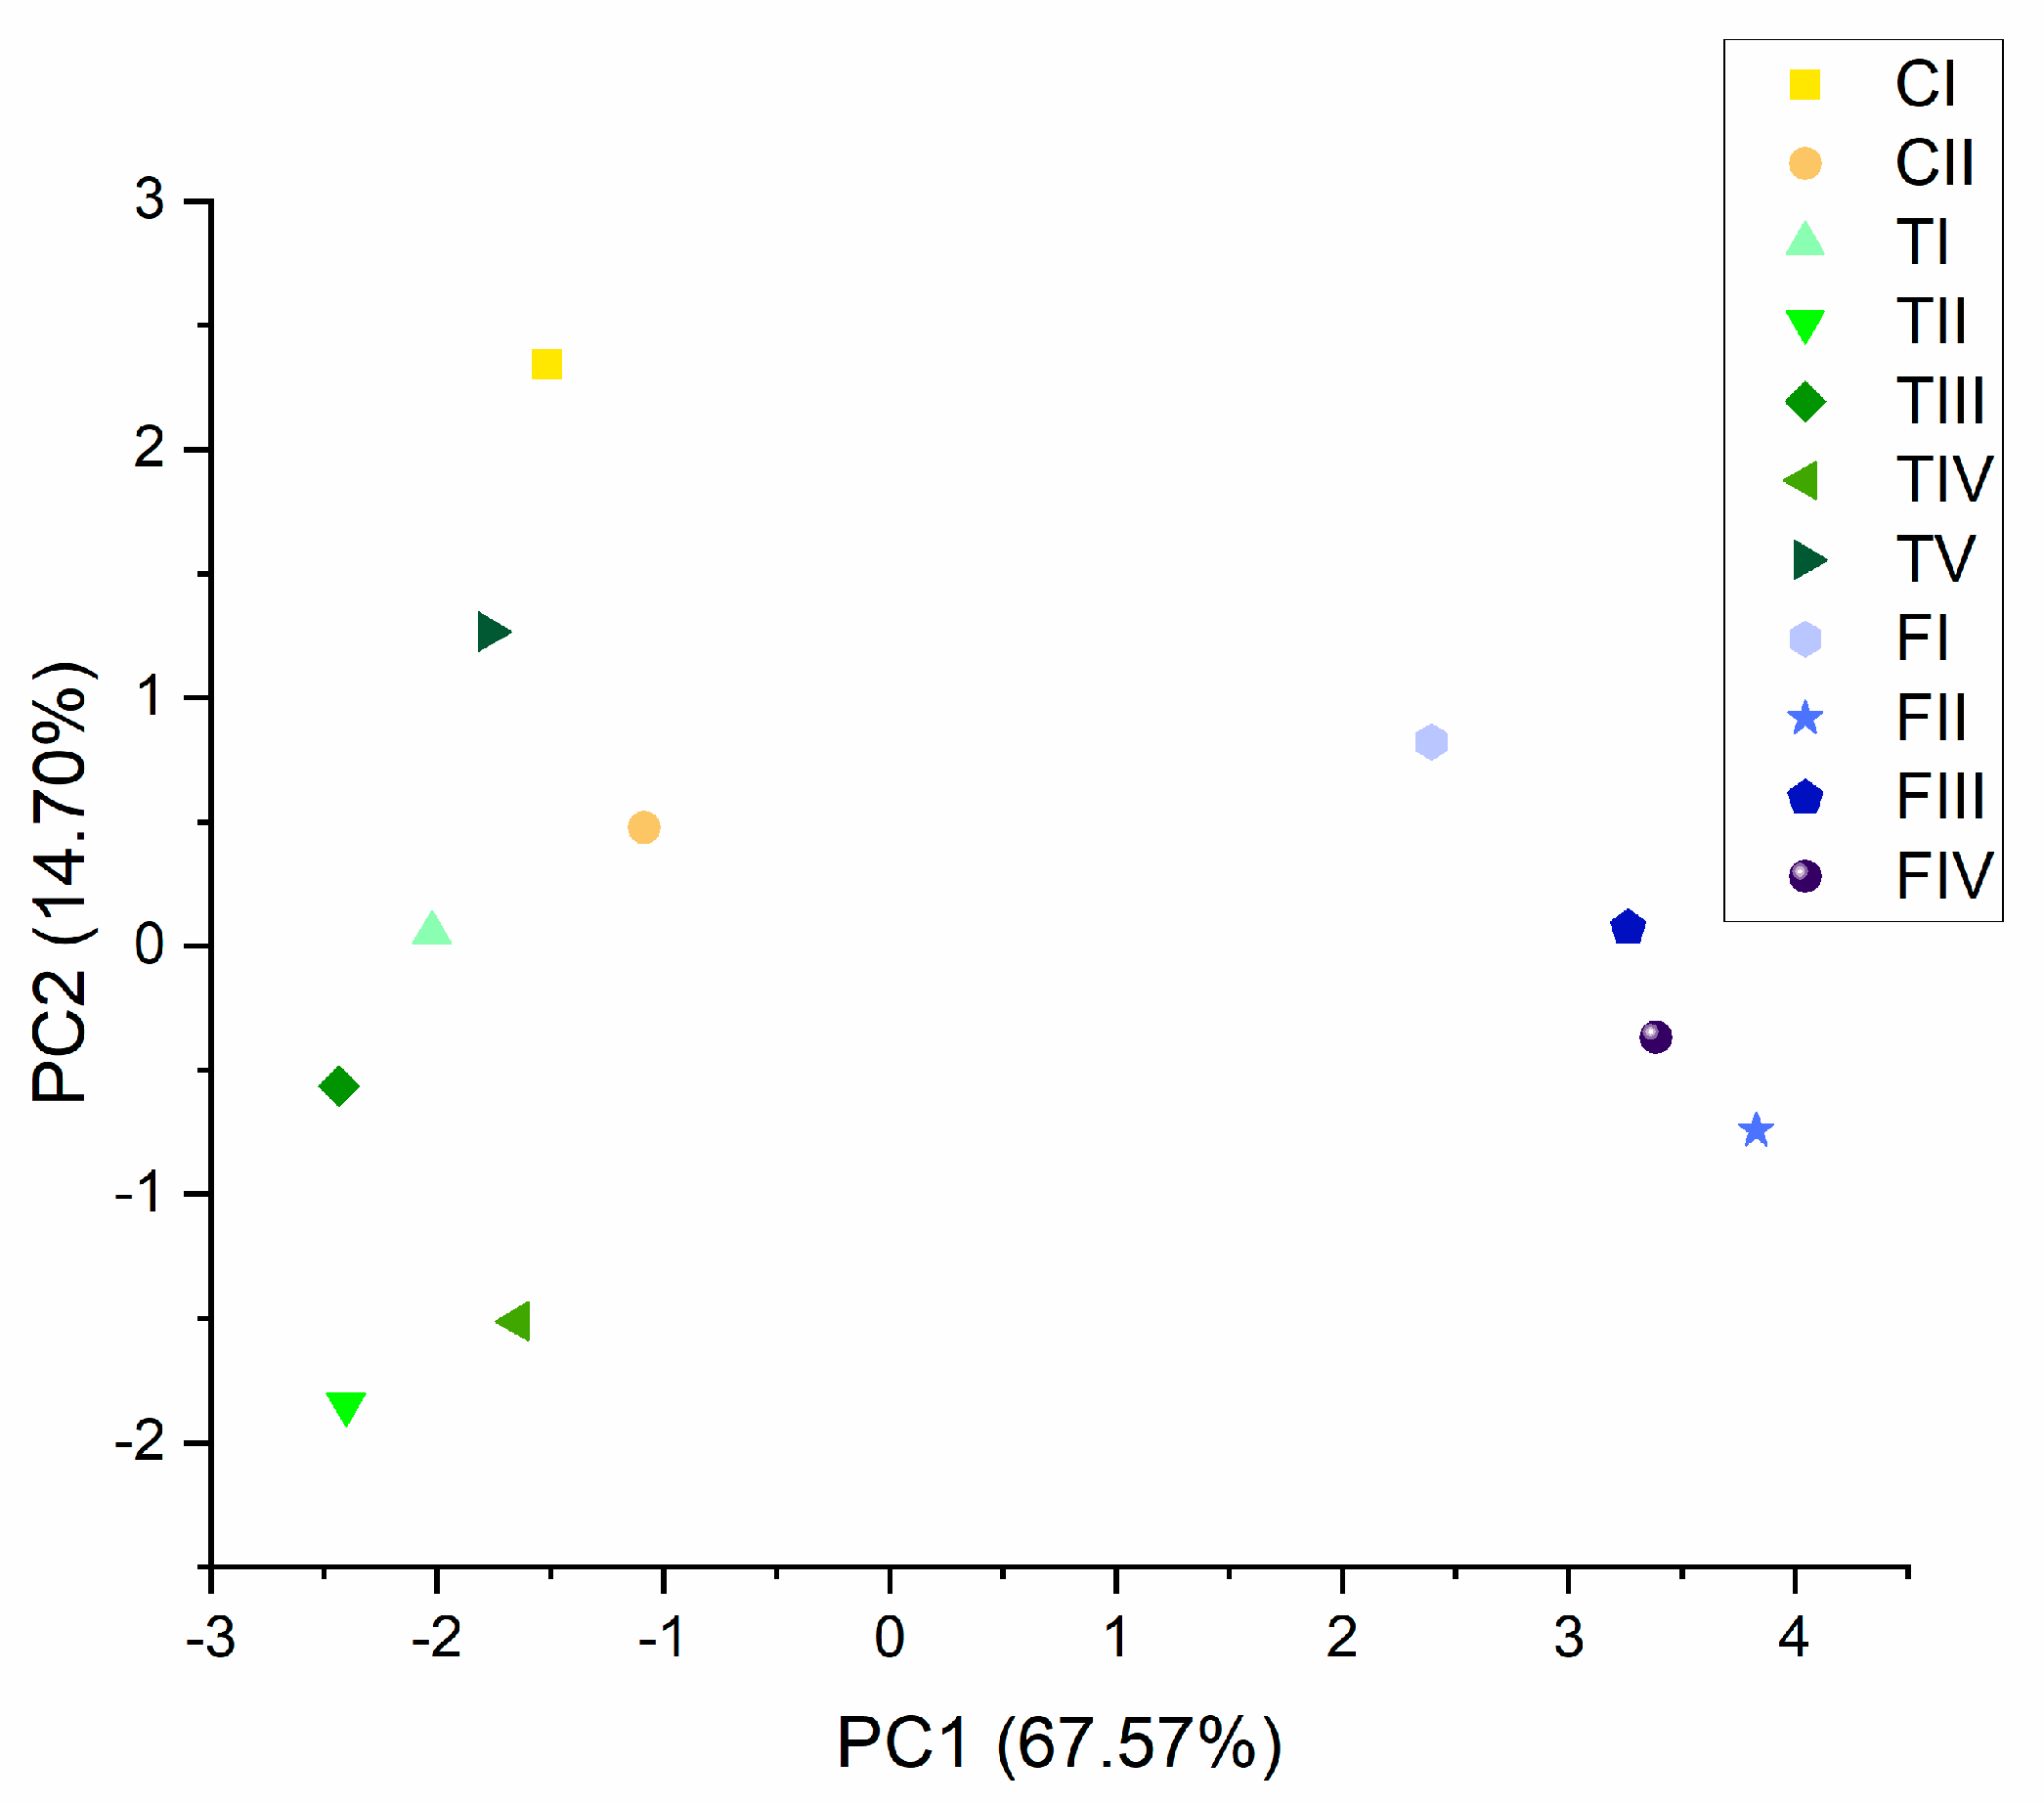
Size of this preview: 679 × 599 pixels. Other resolution: 2,091 × 1,846 pixels.
Original file (2,091 × 1,846 pixels, file size: 23 KB, MIME type: image/png)
Summary
| Description |
Fig. 3 Principal component analysis (PCA) plot averages of analyzed cannabinoids for included phenotypes made on the first two PC scores (PC1 explained 67.57%, and PC2 explained 14.70%), with a total variance of 82.27%. |
|---|---|
| Source |
Eržen, M.; Košir, I.J.; Ocvirk, M.; Kreft, S.; Čerenak, A. (2021). "Metabolomic analysis of cannabinoid and essential oil profiles in different hemp (Cannabis sativa L.) phenotypes". Plants 10 (5): 966. doi:10.3390/plants10050966. |
| Date |
2021 |
| Author |
Eržen, M.; Košir, I.J.; Ocvirk, M.; Kreft, S.; Čerenak, A. |
| Permission (Reusing this file) |
|
| Other versions |
Licensing
|
|
This work is licensed under the Creative Commons Attribution 4.0 License. |
File history
Click on a date/time to view the file as it appeared at that time.
| Date/Time | Thumbnail | Dimensions | User | Comment | |
|---|---|---|---|---|---|
| current | 21:58, 15 June 2021 | | 2,091 × 1,846 (23 KB) | Shawndouglas (talk | contribs) |
You cannot overwrite this file.
File usage
The following page uses this file: