Difference between revisions of "File:Fig3 Cicaloni Separ22 9-4.png"
Shawndouglas (talk | contribs) |
Shawndouglas (talk | contribs) (Added summary) |
||
| Line 1: | Line 1: | ||
==Summary== | |||
{{Information | |||
|Description='''Fig. 3''' ('''A'''). Principal component analysis (PCA), score plot. Two-dimensional (2D) PCA scores plot demonstrates statistical clustering for ''C. sativa'' inflorescences cultivars. ('''B'''). Principal component analysis (PCA), biplot. A biplot provides information on both metabolites and samples of a data matrix to be displayed graphically. Metabolites grouped at the origin of the graph do not contribute to samples variability. ('''C'''). Hierarchical clustering (HCA). It shows the dendrogram based on Euclidean distance. ('''D'''). PLS-DA and variable importance in projection (VIP) plot. It displays the top 10 most important metabolite features identified by PLS-DA. Colored boxes on right indicate relative mean percentage of corresponding metabolite for ''C. sativa'' inflorescences. VIP is a weighted sum of squares of the PLS-DA loadings considering the amount of explained Y-variable in each dimension. | |||
|Source={{cite journal |title=Chemical profiling and characterization of different cultivars of ''Cannabis sativa'' L. inflorescences by SPME-GC-MS and UPLC-MS |journal=Separations |author=Cicaloni, V.; Salvini, L.; Vitalini, S.; Garzoli, S. |volume=9 |issue=4 |at=90 |year=2022 |doi=10.3390/separations9040090}} | |||
|Author=Cicaloni, V.; Salvini, L.; Vitalini, S.; Garzoli, S. | |||
|Date=2022 | |||
|Permission=[http://creativecommons.org/licenses/by/4.0/ Creative Commons Attribution 4.0 International] | |||
}} | |||
== Licensing == | == Licensing == | ||
{{cc-by-4.0}} | {{cc-by-4.0}} | ||
Latest revision as of 20:43, 22 August 2022
Summary
| Description |
Fig. 3 (A). Principal component analysis (PCA), score plot. Two-dimensional (2D) PCA scores plot demonstrates statistical clustering for C. sativa inflorescences cultivars. (B). Principal component analysis (PCA), biplot. A biplot provides information on both metabolites and samples of a data matrix to be displayed graphically. Metabolites grouped at the origin of the graph do not contribute to samples variability. (C). Hierarchical clustering (HCA). It shows the dendrogram based on Euclidean distance. (D). PLS-DA and variable importance in projection (VIP) plot. It displays the top 10 most important metabolite features identified by PLS-DA. Colored boxes on right indicate relative mean percentage of corresponding metabolite for C. sativa inflorescences. VIP is a weighted sum of squares of the PLS-DA loadings considering the amount of explained Y-variable in each dimension. |
|---|---|
| Source |
Cicaloni, V.; Salvini, L.; Vitalini, S.; Garzoli, S. (2022). "Chemical profiling and characterization of different cultivars of Cannabis sativa L. inflorescences by SPME-GC-MS and UPLC-MS". Separations 9 (4): 90. doi:10.3390/separations9040090. |
| Date |
2022 |
| Author |
Cicaloni, V.; Salvini, L.; Vitalini, S.; Garzoli, S. |
| Permission (Reusing this file) |
|
| Other versions |
Licensing
|
|
This work is licensed under the Creative Commons Attribution 4.0 License. |
File history
Click on a date/time to view the file as it appeared at that time.
| Date/Time | Thumbnail | Dimensions | User | Comment | |
|---|---|---|---|---|---|
| current | 20:39, 22 August 2022 | 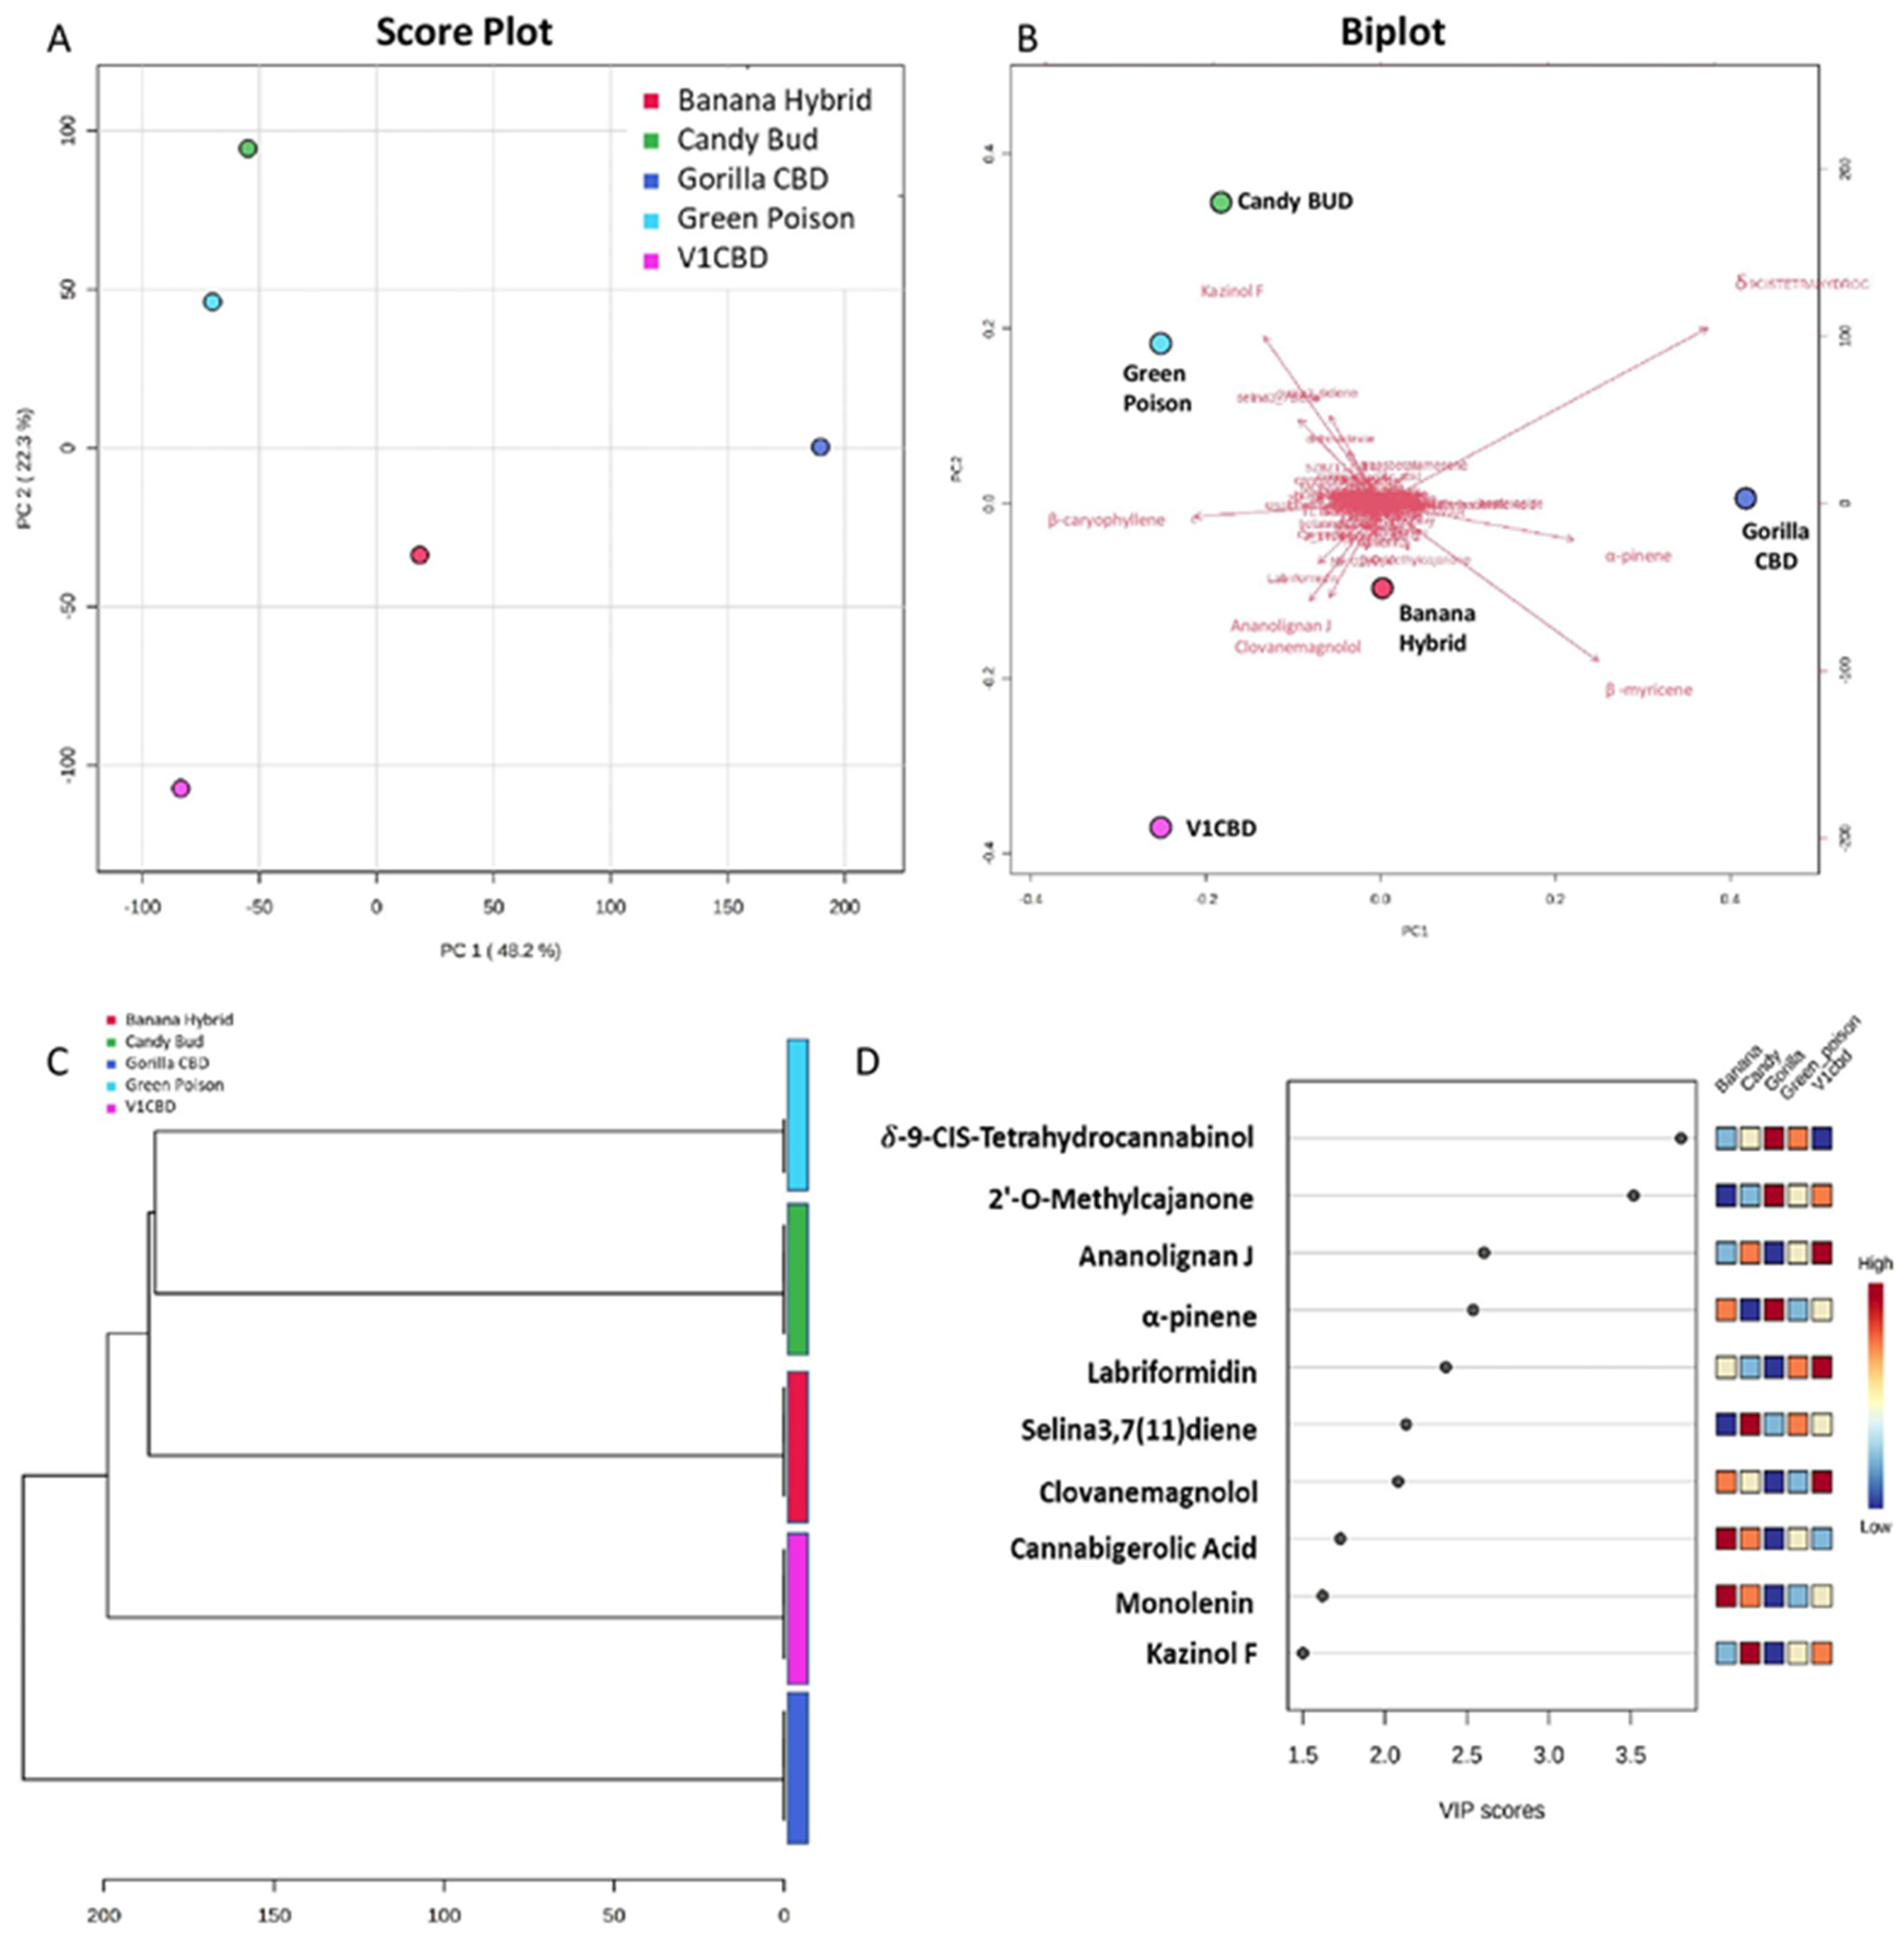 | 4,054 × 4,126 (1.57 MB) | Shawndouglas (talk | contribs) |
You cannot overwrite this file.
File usage
The following page uses this file: