File:Fig3 Chambers JofCannRes23 5.png
Original file (1,416 × 576 pixels, file size: 283 KB, MIME type: image/png)
Summary
| Description |
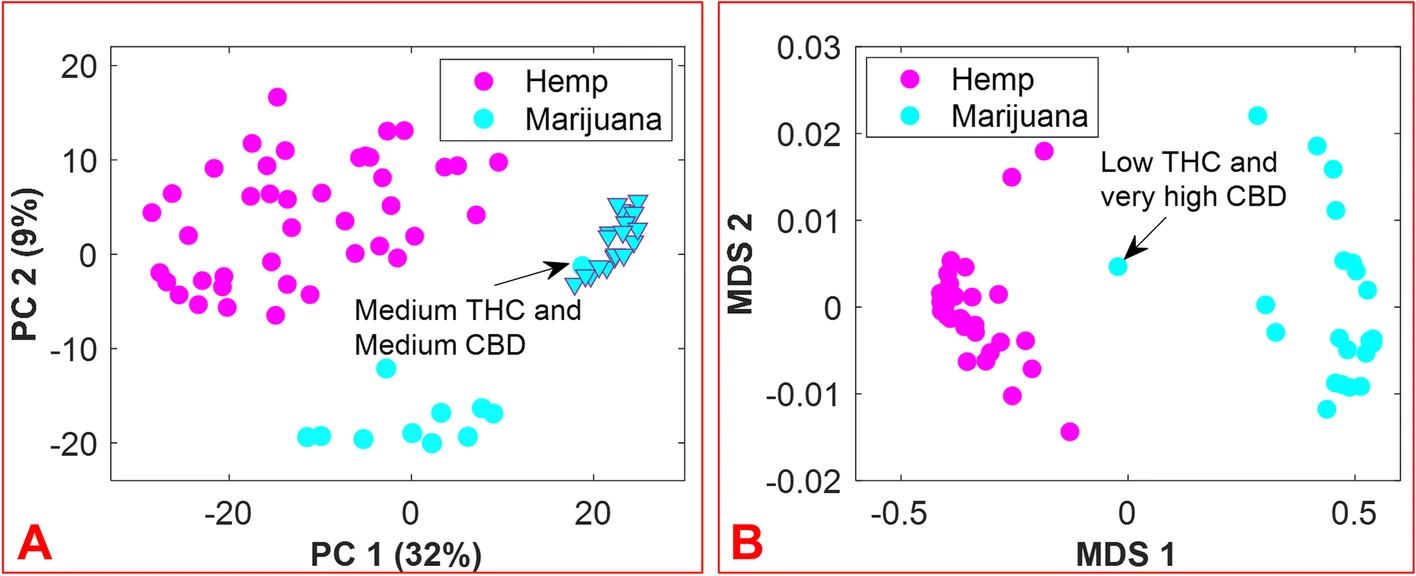
Fig. 3 2D score plot resulting from PCA of hemp and marijuana sample spectra (panel A); 2D score plot of multidimensional scaling (MDS) analysis of the proximity matrix resulting from the application of supervised random forest (panel B). The magenta and cyan colors represent hemp and marijuana, respectively. The cyan triangles show the subset of recreational marijuana samples. |
|---|---|
| Source |
Chambers, M.I.; Beyramysoltan, S.; Garosi, B.; Musah, R.A. (2023). "Combined ambient ionization mass spectrometric and chemometric approach for the differentiation of hemp and marijuana varieties of Cannabis sativa". Journal of Cannabis Research 5: 5. doi:10.1186/s42238-023-00173-0. |
| Date |
2023 |
| Author |
Chambers, M.I.; Beyramysoltan, S.; Garosi, B.; Musah, R.A. |
| Permission (Reusing this file) |
|
| Other versions |
Licensing
|
|
This work is licensed under the Creative Commons Attribution 4.0 License. |
File history
Click on a date/time to view the file as it appeared at that time.
| Date/Time | Thumbnail | Dimensions | User | Comment | |
|---|---|---|---|---|---|
| current | 20:44, 28 June 2023 | 1,416 × 576 (283 KB) | Shawndouglas (talk | contribs) |
You cannot overwrite this file.