File:Fig2 Cicaloni Separ22 9-4.png
Original file (3,384 × 4,934 pixels, file size: 2.77 MB, MIME type: image/png)
Summary
| Description |
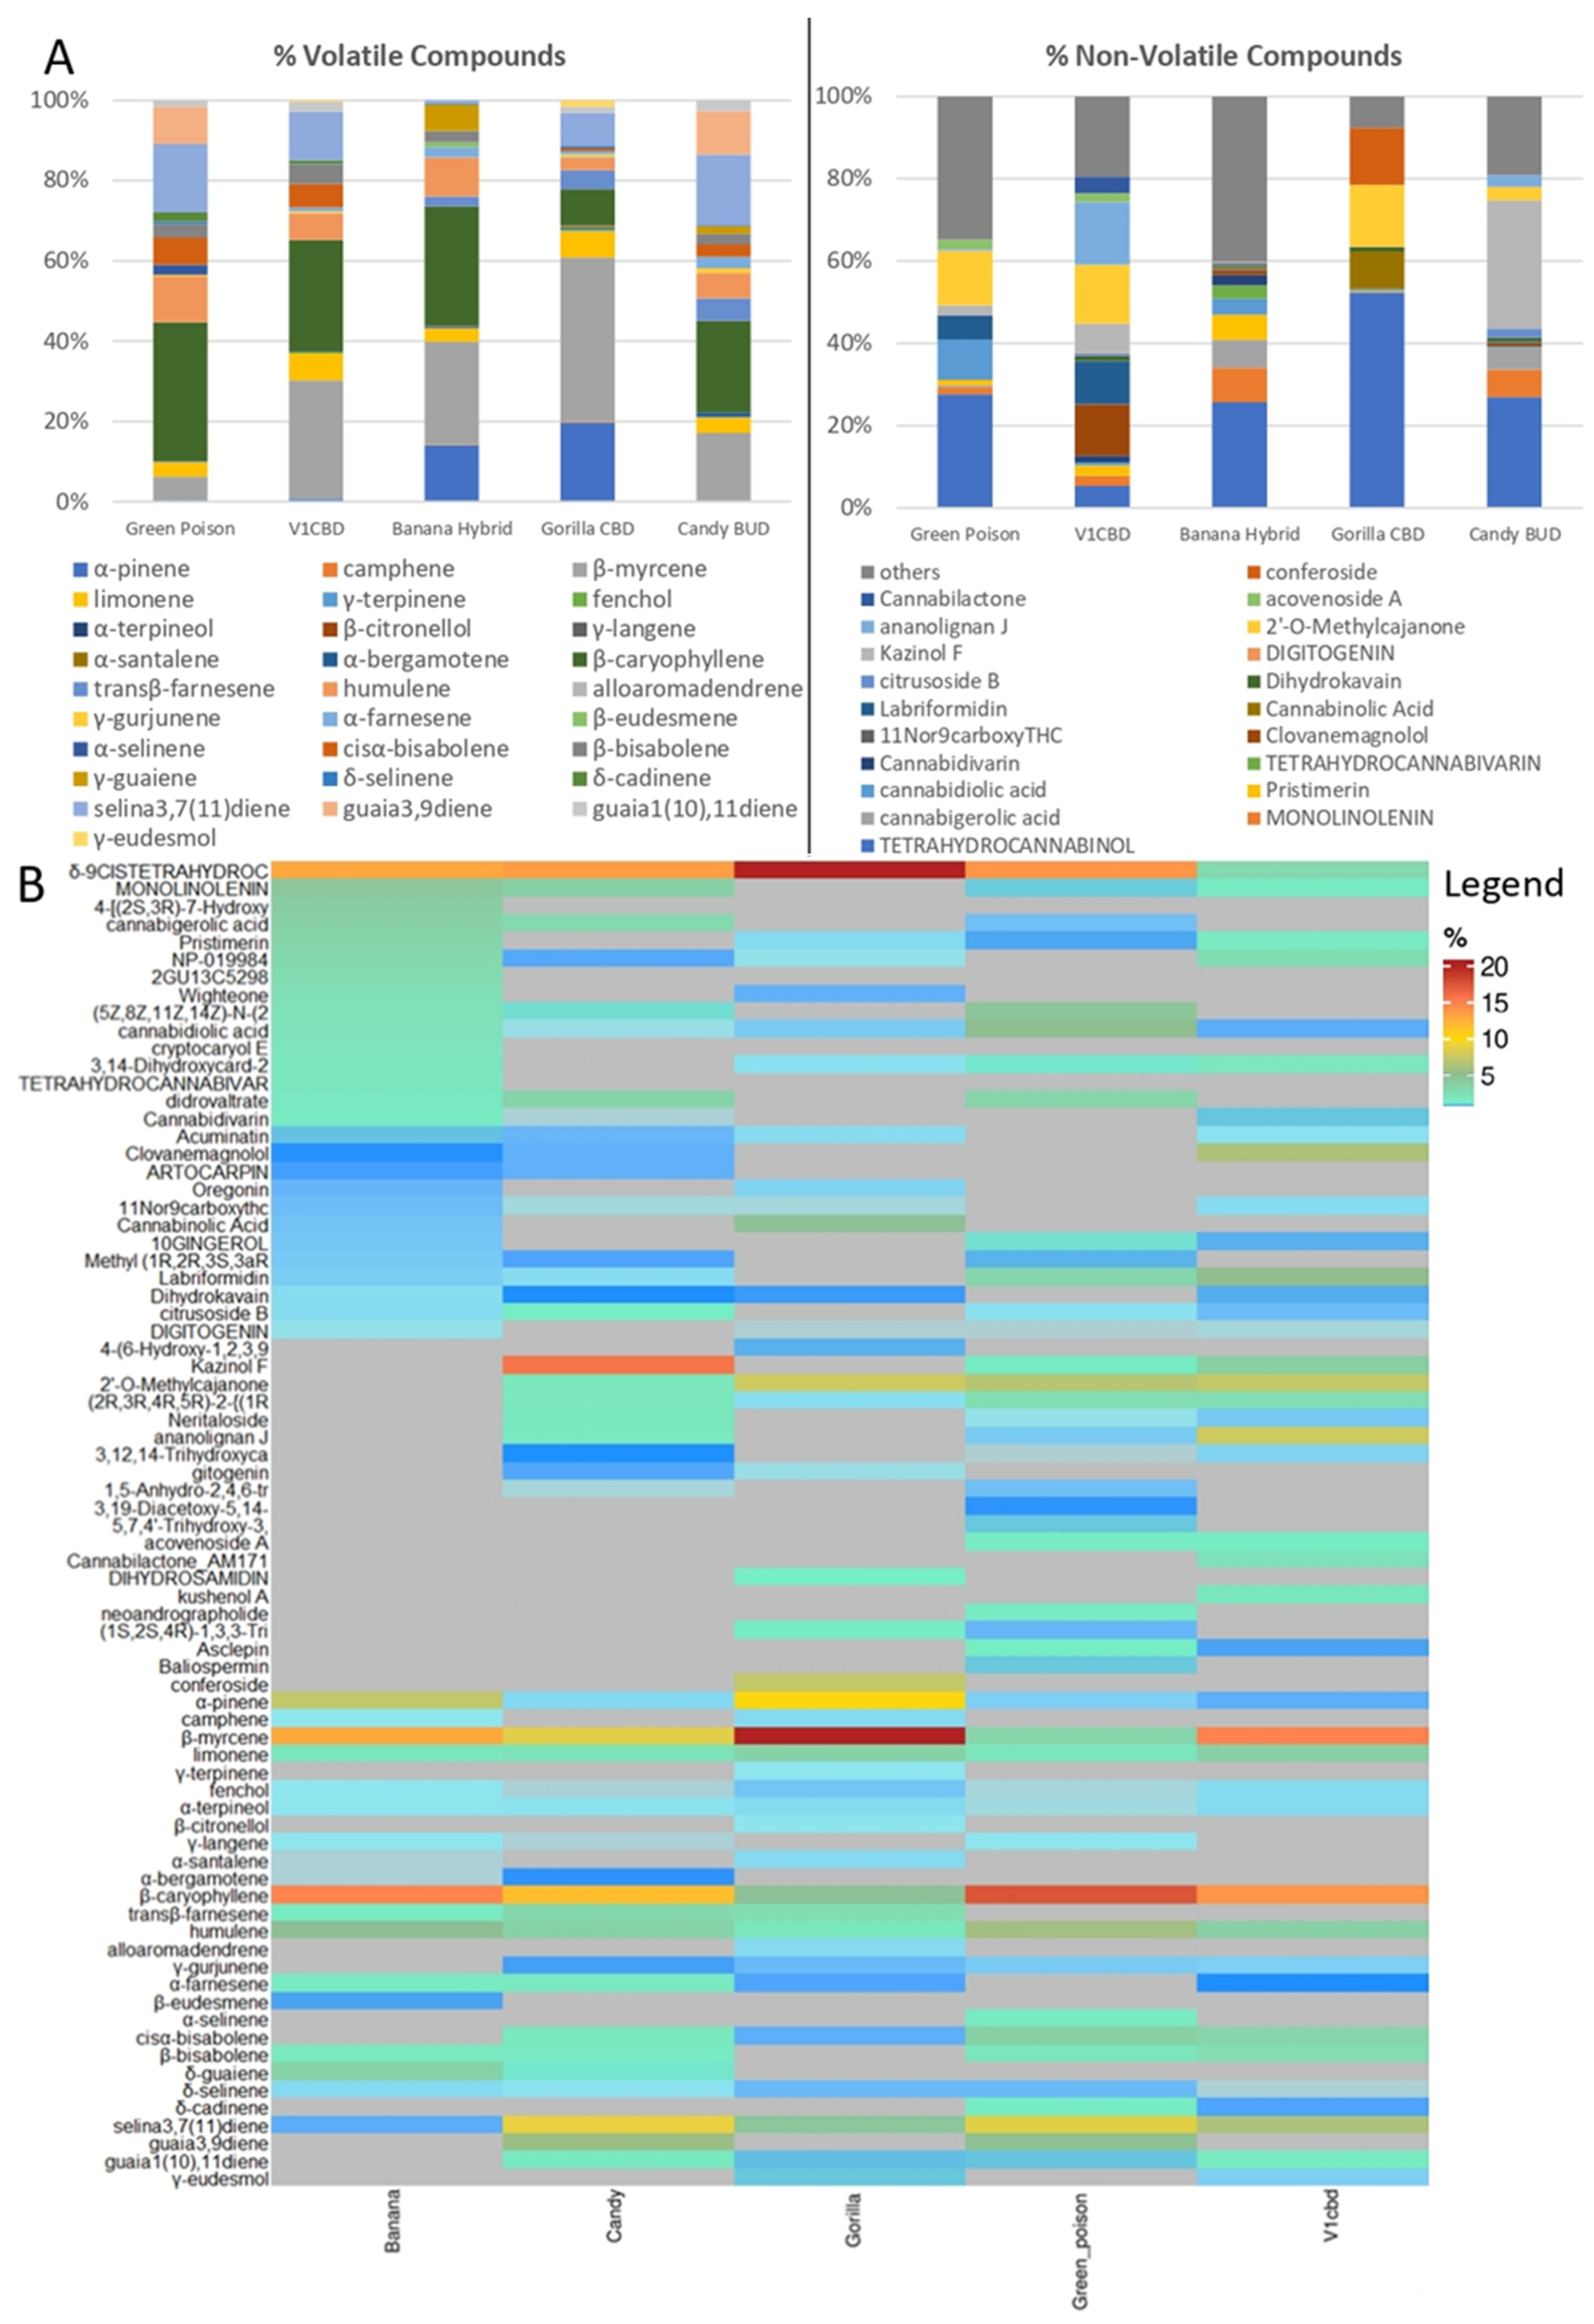
Fig. 2 (A). Bar plot of the chemical composition (percentage mean value) of C. sativa inflorescences for volatile and non-volatile compounds. (B). Heat map of normalized by sum metabolites percentage in five cultivars of C. sativa L. Each cultivar is indicated in the column, every row indicates a compound. Red indicates high abundance, whereas compounds under the detection threshold are in gray. |
|---|---|
| Source |
Cicaloni, V.; Salvini, L.; Vitalini, S.; Garzoli, S. (2022). "Chemical profiling and characterization of different cultivars of Cannabis sativa L. inflorescences by SPME-GC-MS and UPLC-MS". Separations 9 (4): 90. doi:10.3390/separations9040090. |
| Date |
2022 |
| Author |
Cicaloni, V.; Salvini, L.; Vitalini, S.; Garzoli, S. |
| Permission (Reusing this file) |
|
| Other versions |
Licensing
|
|
This work is licensed under the Creative Commons Attribution 4.0 License. |
File history
Click on a date/time to view the file as it appeared at that time.
| Date/Time | Thumbnail | Dimensions | User | Comment | |
|---|---|---|---|---|---|
| current | 20:28, 22 August 2022 | | 3,384 × 4,934 (2.77 MB) | Shawndouglas (talk | contribs) |
You cannot overwrite this file.
File usage
The following page uses this file: