File:Fig2 Amini JofCannRes22 4.png
Original file (1,932 × 760 pixels, file size: 356 KB, MIME type: image/png)
Summary
| Description |
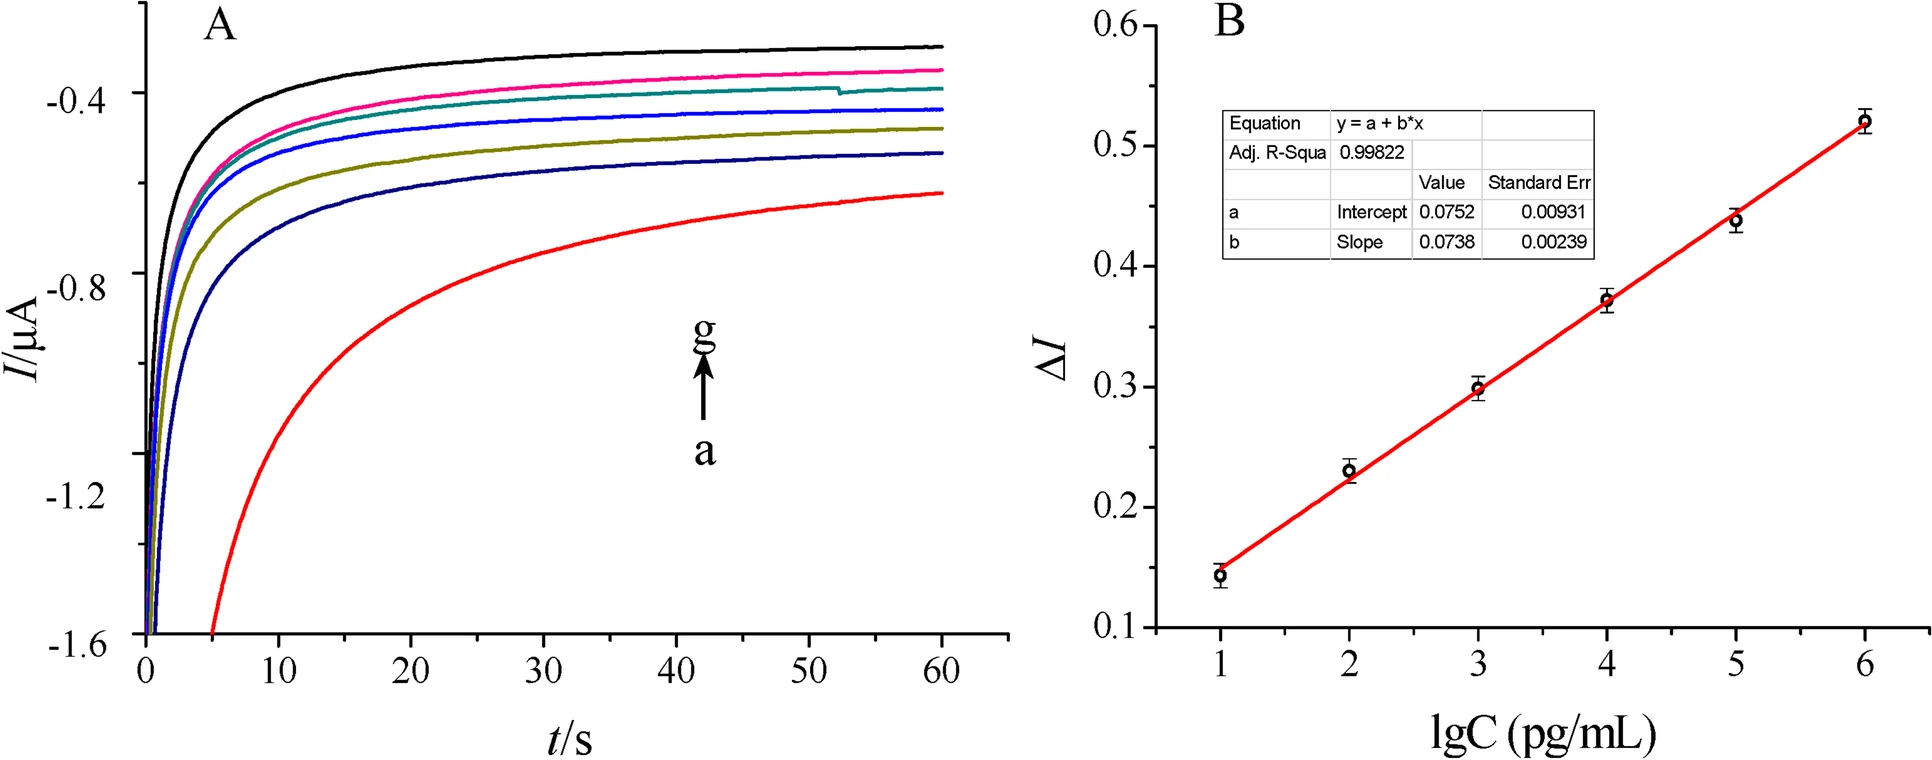
Fig. 2 (A) Current response curves obtained for the determination of THC: a 0.01 M PBS (phosphate buffer saline) solution at pH 7.4 as the blank; b~g are the signals obtained for diluted THC solutions at increasing proportions with PBS, and the mass concentration was 0.01~103 ng/mL. (B) Calibration curve for the determination of THC, taken from Dingqiang et al. 2016, per the Creative Commons Attribution 4.0 license |
|---|---|
| Source |
Amini, K.; Sepehrifard, A.; Valinasabpouri, A.; Safruk, J.; Angelone, D.; de Campos Lourenco, T. (2022). "Recent advances in electrochemical sensor technologies for THC detection—A narrative review". Journal of Cannabis Research 4: 12. doi:10.1186/s42238-022-00122-3. |
| Date |
2022 |
| Author |
Amini, K.; Sepehrifard, A.; Valinasabpouri, A.; Safruk, J.; Angelone, D.; de Campos Lourenco, T. |
| Permission (Reusing this file) |
|
| Other versions |
Licensing
|
|
This work is licensed under the Creative Commons Attribution 4.0 License. |
File history
Click on a date/time to view the file as it appeared at that time.
| Date/Time | Thumbnail | Dimensions | User | Comment | |
|---|---|---|---|---|---|
| current | 17:38, 29 May 2022 | 1,932 × 760 (356 KB) | Shawndouglas (talk | contribs) |
You cannot overwrite this file.
File usage
The following page uses this file: