Difference between revisions of "File:Fig1 Hussain iScience2021 24-12.jpg"
Shawndouglas (talk | contribs) |
Shawndouglas (talk | contribs) (Added summary) |
||
| Line 1: | Line 1: | ||
==Summary== | |||
{{Information | |||
|Description='''Fig. 1''' Cannabis research trend. ('''A''') Timeline of cannabis records. Timeline and years from the earliest to the latest cannabis records in the literature databases of life science and biomedical journals are depicted with a color coded radial bar for Europe PMC (green), Scopus (blue), Pubmed Central (gray), and Web of Science (lilac). The publication year of the first available cannabis-related document in each database is marked by a vertical line at top of corresponding bar. The number of years from the oldest available article to the most recent publication in 2021 are indicated at the base of each bar. ('''B''') Cannabis documents in the literature archives. The bar plot shows number of documents in the selected databases, with Y axis divided into two sections to show the journals (upper section) and articles (lower section). ('''C''') Common citations in databases. Europe PMC, Scopus and Pubmed Central records were compared using DOI identifiers, and the number of shared and unique documents between three sets are shown as a Venn plot. The size of the circle corresponds to the number of articles with a DOI in each database. ('''D''') Cannabis literature source in Europe PMC. Color-coded pie chart depicts the source repositories of cannabis articles in Europe PMC. The contribution (percentage of articles) from Medline (MED), AGRICOLA (AGR), PubMed Central (PMC) and Chinese Biological Abstracts (CBA) are shown by orange, gray, turquoise, and cyan color, respectively. ('''E''') Cannabis research trends. The overall pattern of cannabis research from 1783 to 2021 is depicted by the trend line (log scaled), with each dot representing the number of articles (Y axis) per year (X axis). The research periods are categorized as zero (1783–1840), I (1840–1937), II (1937–1996), and III (1996–2021), and they are separated by vertical dotted lines. The three major achievements—(I) discovery of cannabinoids, ii) cannabinoid receptors, and iii) endocannabinoids—that pushed the interest in cannabis are marked in pink color. The number of articles in 2021 are still growing and therefore depicted as a hollow enlarged dot. ('''F''') Cannabis research subjects. A bubble plot depicts the most and least explored scientific subject areas, with size corresponding to the number of articles (Y axis) and journals (Y axis) in each category. A major proportion of cannabis research was related to medical and medicinal sciences, followed by pharmacology and pharmaceuticals, neurosciences and psychology, biochemistry and biotechnology, genetics and genomic sciences, agriculture and plant biology, and bioinformatics. | |||
|Source={{cite journal |title=Cannabis sativa research trends, challenges, and new-age perspectives |journal=iScience |author=Hussain, T.; Jeena, G.; Pitakbut, T.; Vasilev, N.; Kayser, O. |volume=24 |issue=12 |at=103391 |year=2021 |doi=10.1016/j.isci.2021.103391}} | |||
|Author=Hussain, T.; Jeena, G.; Pitakbut, T.; Vasilev, N.; Kayser, O. | |||
|Date=2021 | |||
|Permission=[https://creativecommons.org/licenses/by-nc-nd/4.0/ Creative Commons Attribution-NonCommercial-NoDerivatives 4.0 International] | |||
}} | |||
== Licensing == | == Licensing == | ||
{{cc-by-nc-nd-4.0}} | {{cc-by-nc-nd-4.0}} | ||
Latest revision as of 17:01, 2 April 2022
Summary
| Description |
Fig. 1 Cannabis research trend. (A) Timeline of cannabis records. Timeline and years from the earliest to the latest cannabis records in the literature databases of life science and biomedical journals are depicted with a color coded radial bar for Europe PMC (green), Scopus (blue), Pubmed Central (gray), and Web of Science (lilac). The publication year of the first available cannabis-related document in each database is marked by a vertical line at top of corresponding bar. The number of years from the oldest available article to the most recent publication in 2021 are indicated at the base of each bar. (B) Cannabis documents in the literature archives. The bar plot shows number of documents in the selected databases, with Y axis divided into two sections to show the journals (upper section) and articles (lower section). (C) Common citations in databases. Europe PMC, Scopus and Pubmed Central records were compared using DOI identifiers, and the number of shared and unique documents between three sets are shown as a Venn plot. The size of the circle corresponds to the number of articles with a DOI in each database. (D) Cannabis literature source in Europe PMC. Color-coded pie chart depicts the source repositories of cannabis articles in Europe PMC. The contribution (percentage of articles) from Medline (MED), AGRICOLA (AGR), PubMed Central (PMC) and Chinese Biological Abstracts (CBA) are shown by orange, gray, turquoise, and cyan color, respectively. (E) Cannabis research trends. The overall pattern of cannabis research from 1783 to 2021 is depicted by the trend line (log scaled), with each dot representing the number of articles (Y axis) per year (X axis). The research periods are categorized as zero (1783–1840), I (1840–1937), II (1937–1996), and III (1996–2021), and they are separated by vertical dotted lines. The three major achievements—(I) discovery of cannabinoids, ii) cannabinoid receptors, and iii) endocannabinoids—that pushed the interest in cannabis are marked in pink color. The number of articles in 2021 are still growing and therefore depicted as a hollow enlarged dot. (F) Cannabis research subjects. A bubble plot depicts the most and least explored scientific subject areas, with size corresponding to the number of articles (Y axis) and journals (Y axis) in each category. A major proportion of cannabis research was related to medical and medicinal sciences, followed by pharmacology and pharmaceuticals, neurosciences and psychology, biochemistry and biotechnology, genetics and genomic sciences, agriculture and plant biology, and bioinformatics. |
|---|---|
| Source |
Hussain, T.; Jeena, G.; Pitakbut, T.; Vasilev, N.; Kayser, O. (2021). "Cannabis sativa research trends, challenges, and new-age perspectives". iScience 24 (12): 103391. doi:10.1016/j.isci.2021.103391. |
| Date |
2021 |
| Author |
Hussain, T.; Jeena, G.; Pitakbut, T.; Vasilev, N.; Kayser, O. |
| Permission (Reusing this file) |
Creative Commons Attribution-NonCommercial-NoDerivatives 4.0 International |
| Other versions |
Licensing
|
|
This work is licensed under the Creative Commons Attribution-NonCommercial-NoDerivatives 4.0 International License. |
File history
Click on a date/time to view the file as it appeared at that time.
| Date/Time | Thumbnail | Dimensions | User | Comment | |
|---|---|---|---|---|---|
| current | 16:50, 2 April 2022 | 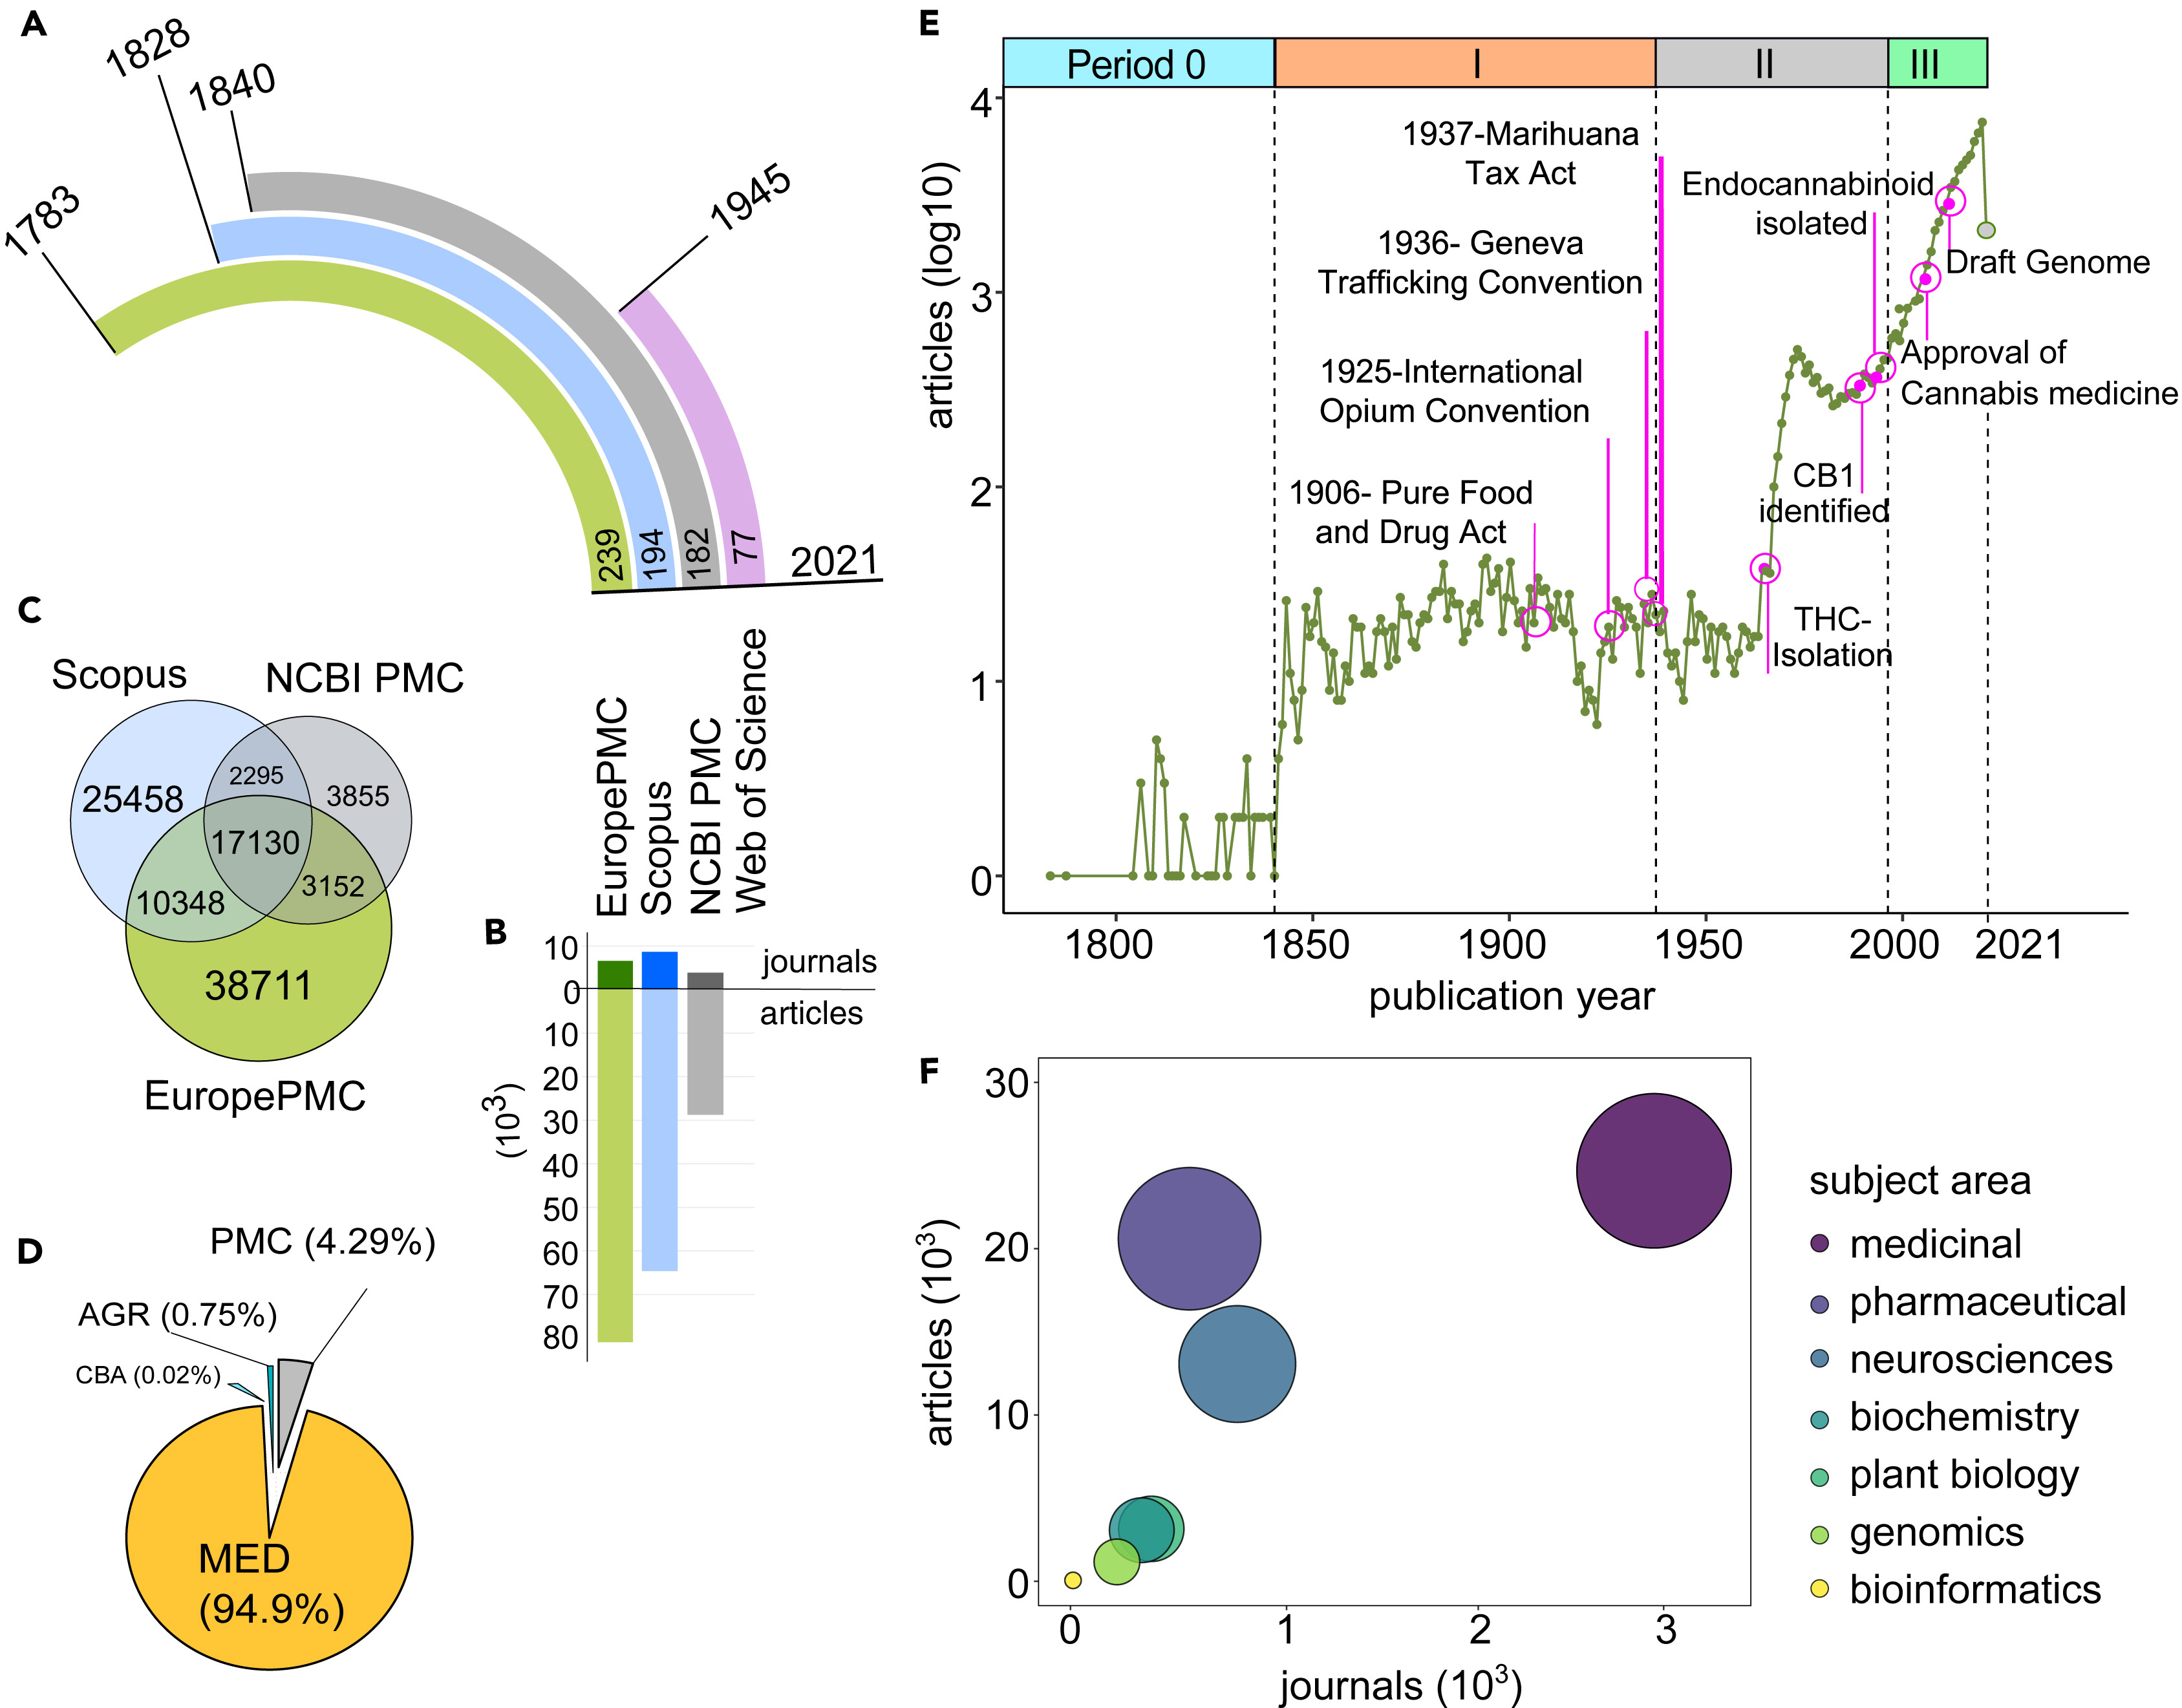 | 3,375 × 2,642 (817 KB) | Shawndouglas (talk | contribs) |
You cannot overwrite this file.
File usage
The following page uses this file: