File:Fig19 Sutton SmartAgTech2023 3.jpg
Original file (2,175 × 1,723 pixels, file size: 231 KB, MIME type: image/jpeg)
Summary
| Description |
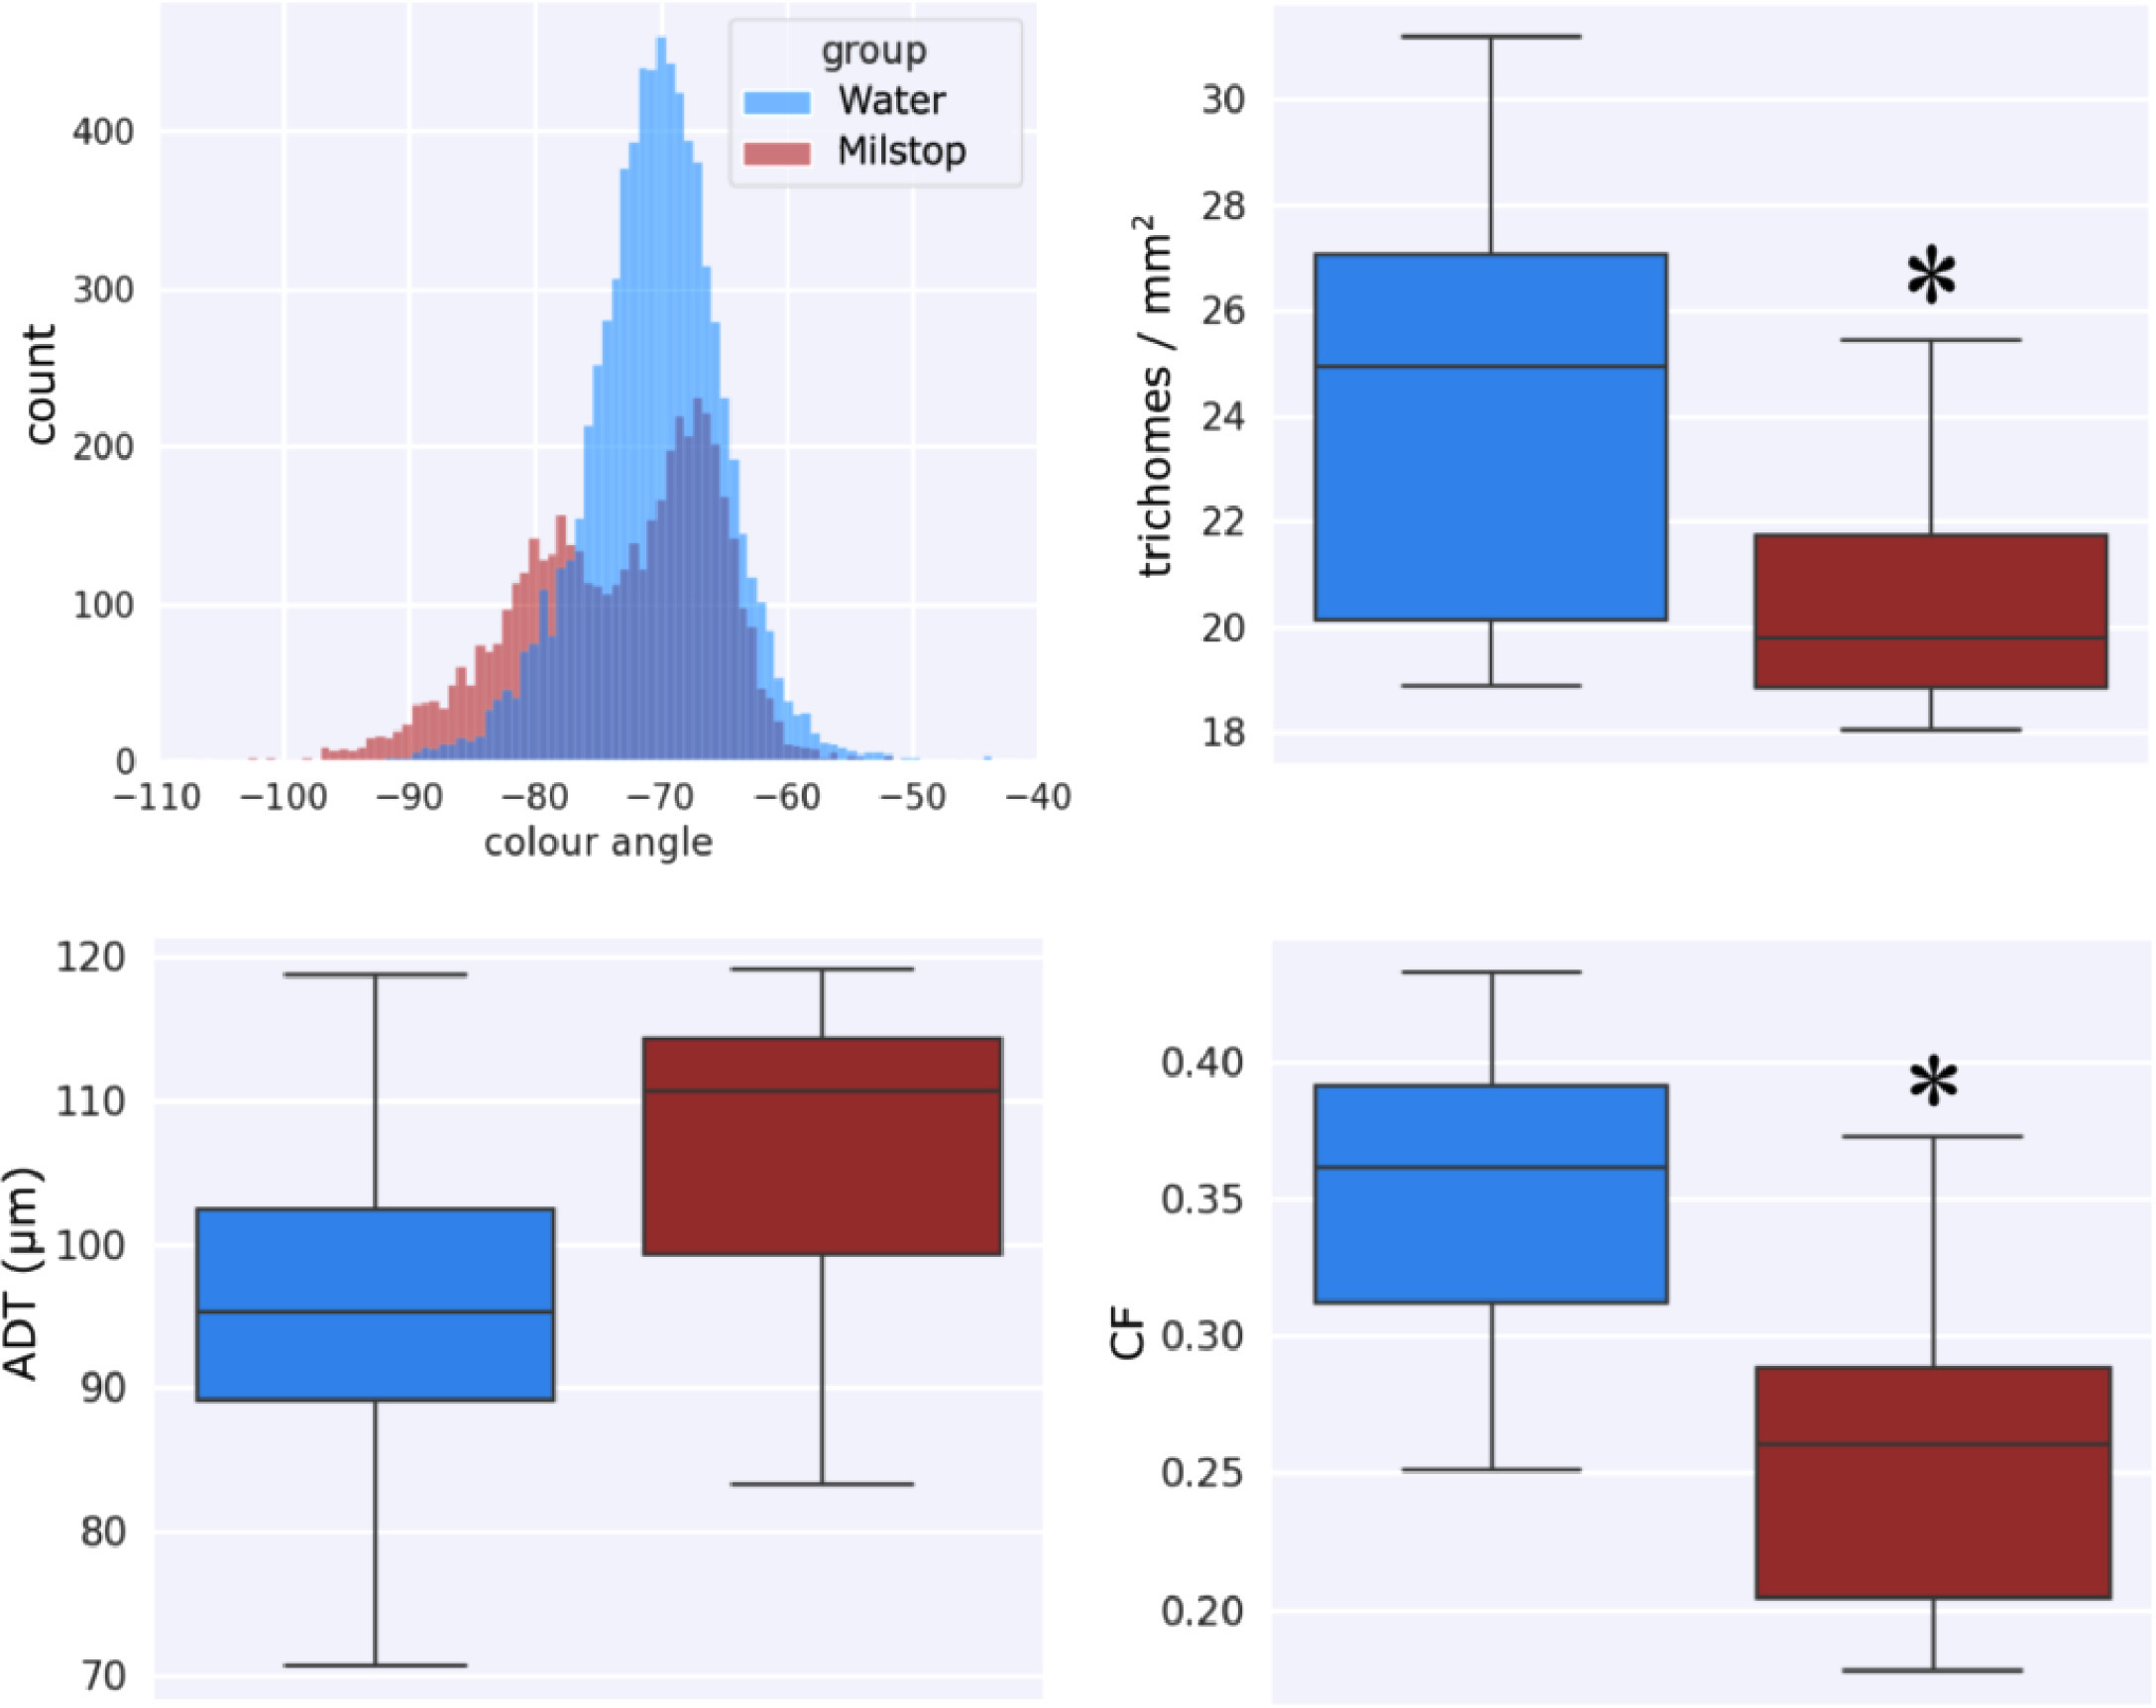
Fig. 19 Color figure of how Milstop application affects trichome morphology. Clockwise from top left: Fluorescence CIELAB color angle (greener color angles are more negative) of control and Milstop treated trichomes, distribution means are significantly different at p < 0.01, Milstop significantly reduces trichome density at p < 0.05, Milstop significantly reduces clumping factor at p < 0.05, Milstop does not significantly affect the distance to the nearest trichome. |
|---|---|
| Source |
Sutton, D.B.; Punja, Z.K.; Hamarneh, G. (2023). "Characterization of trichome phenotypes to assess maturation and flower development in Cannabis sativa L. (cannabis) by automatic trichome gland analysis". Smart Agricultural Technology 3: 100111. doi:10.1016/j.atech.2022.100111. |
| Date |
2023 |
| Author |
Sutton, D.B.; Punja, Z.K.; Hamarneh, G. |
| Permission (Reusing this file) |
Creative Commons Attribution-NonCommercial-NoDerivatives 4.0 International |
| Other versions |
Licensing
|
|
This work is licensed under the Creative Commons Attribution-NonCommercial-NoDerivatives 4.0 International License. |
File history
Click on a date/time to view the file as it appeared at that time.
| Date/Time | Thumbnail | Dimensions | User | Comment | |
|---|---|---|---|---|---|
| current | 17:57, 7 June 2023 | | 2,175 × 1,723 (231 KB) | Shawndouglas (talk | contribs) |
You cannot overwrite this file.
File usage
The following page uses this file: