File:Fig17 Sutton SmartAgTech2023 3.jpg
Original file (3,214 × 819 pixels, file size: 256 KB, MIME type: image/jpeg)
Summary
| Description |
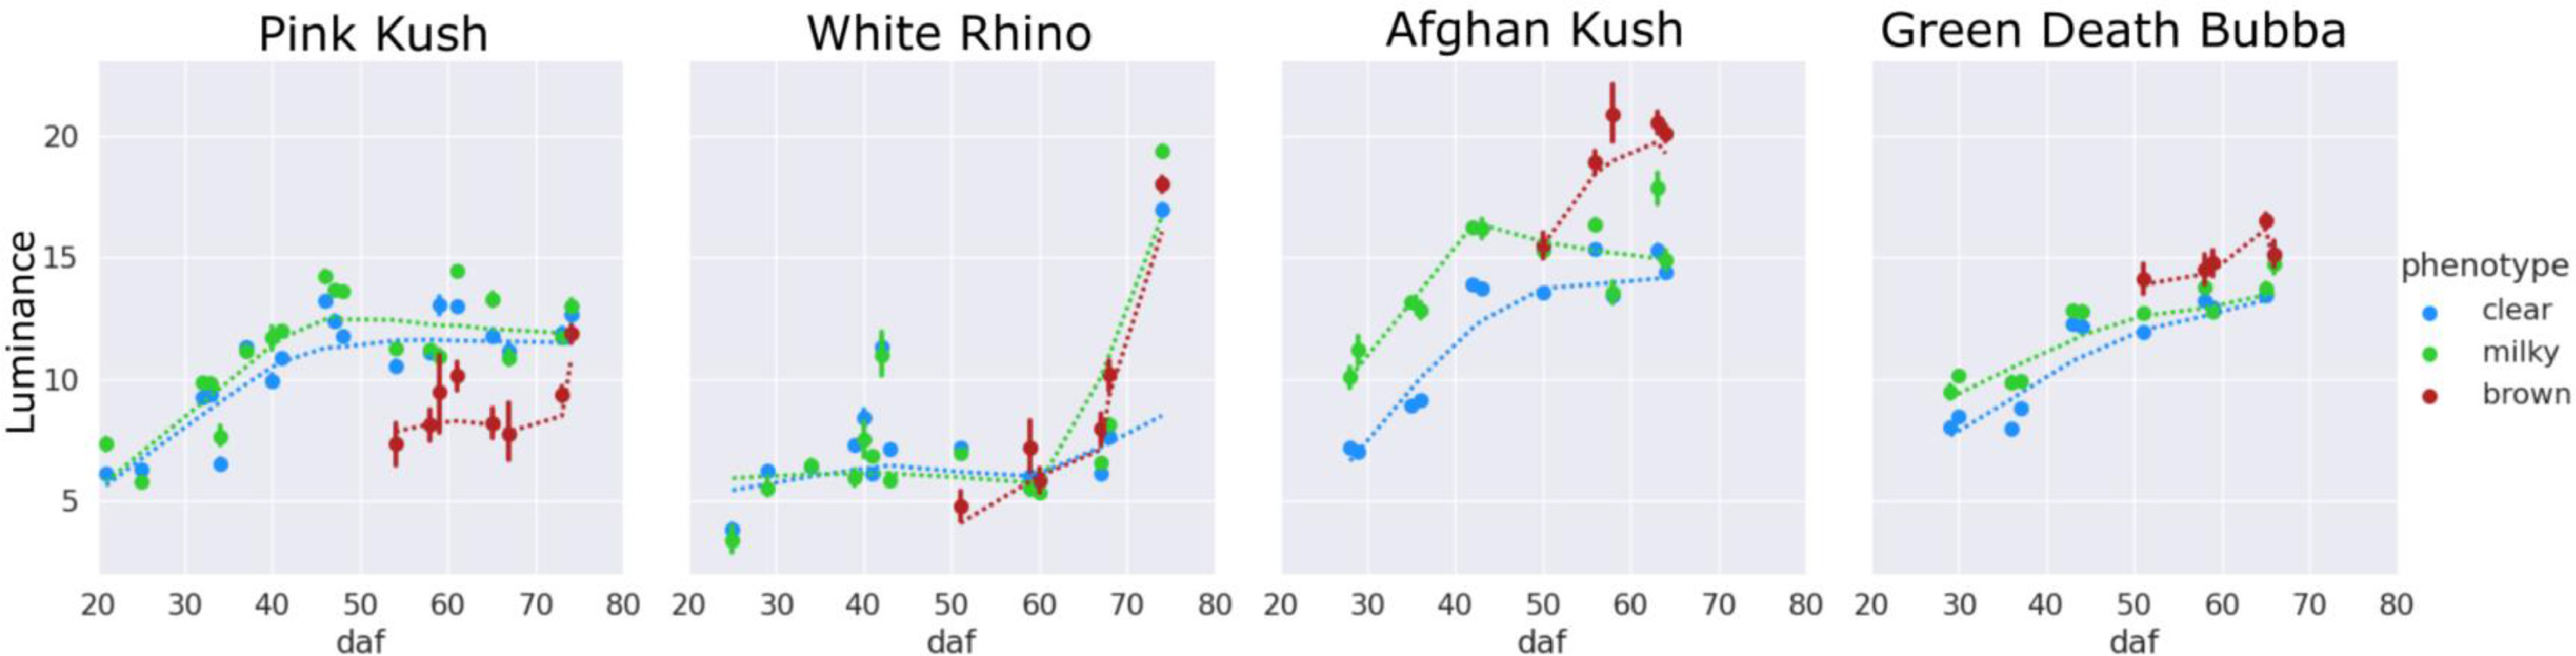
Fig. 17 Color figure of trichome fluorescence luminosity. The L value from the CIELAB color space of fluorescing trichomes, describing fluorescent intensity but not spectrum. All phenotypes clear (blue), milky (green), and brown (red) show increasing average intensity with time, indicating an accumulation of the fluorescent substance. Local regression lines show qualitative trend over the flowering period. |
|---|---|
| Source |
Sutton, D.B.; Punja, Z.K.; Hamarneh, G. (2023). "Characterization of trichome phenotypes to assess maturation and flower development in Cannabis sativa L. (cannabis) by automatic trichome gland analysis". Smart Agricultural Technology 3: 100111. doi:10.1016/j.atech.2022.100111. |
| Date |
2023 |
| Author |
Sutton, D.B.; Punja, Z.K.; Hamarneh, G. |
| Permission (Reusing this file) |
Creative Commons Attribution-NonCommercial-NoDerivatives 4.0 International |
| Other versions |
Licensing
|
|
This work is licensed under the Creative Commons Attribution-NonCommercial-NoDerivatives 4.0 International License. |
File history
Click on a date/time to view the file as it appeared at that time.
| Date/Time | Thumbnail | Dimensions | User | Comment | |
|---|---|---|---|---|---|
| current | 17:46, 7 June 2023 | 3,214 × 819 (256 KB) | Shawndouglas (talk | contribs) |
You cannot overwrite this file.
File usage
The following page uses this file: