File:Fig13 Sutton SmartAgTech2023 3.jpg
Original file (1,589 × 1,376 pixels, file size: 386 KB, MIME type: image/jpeg)
Summary
| Description |
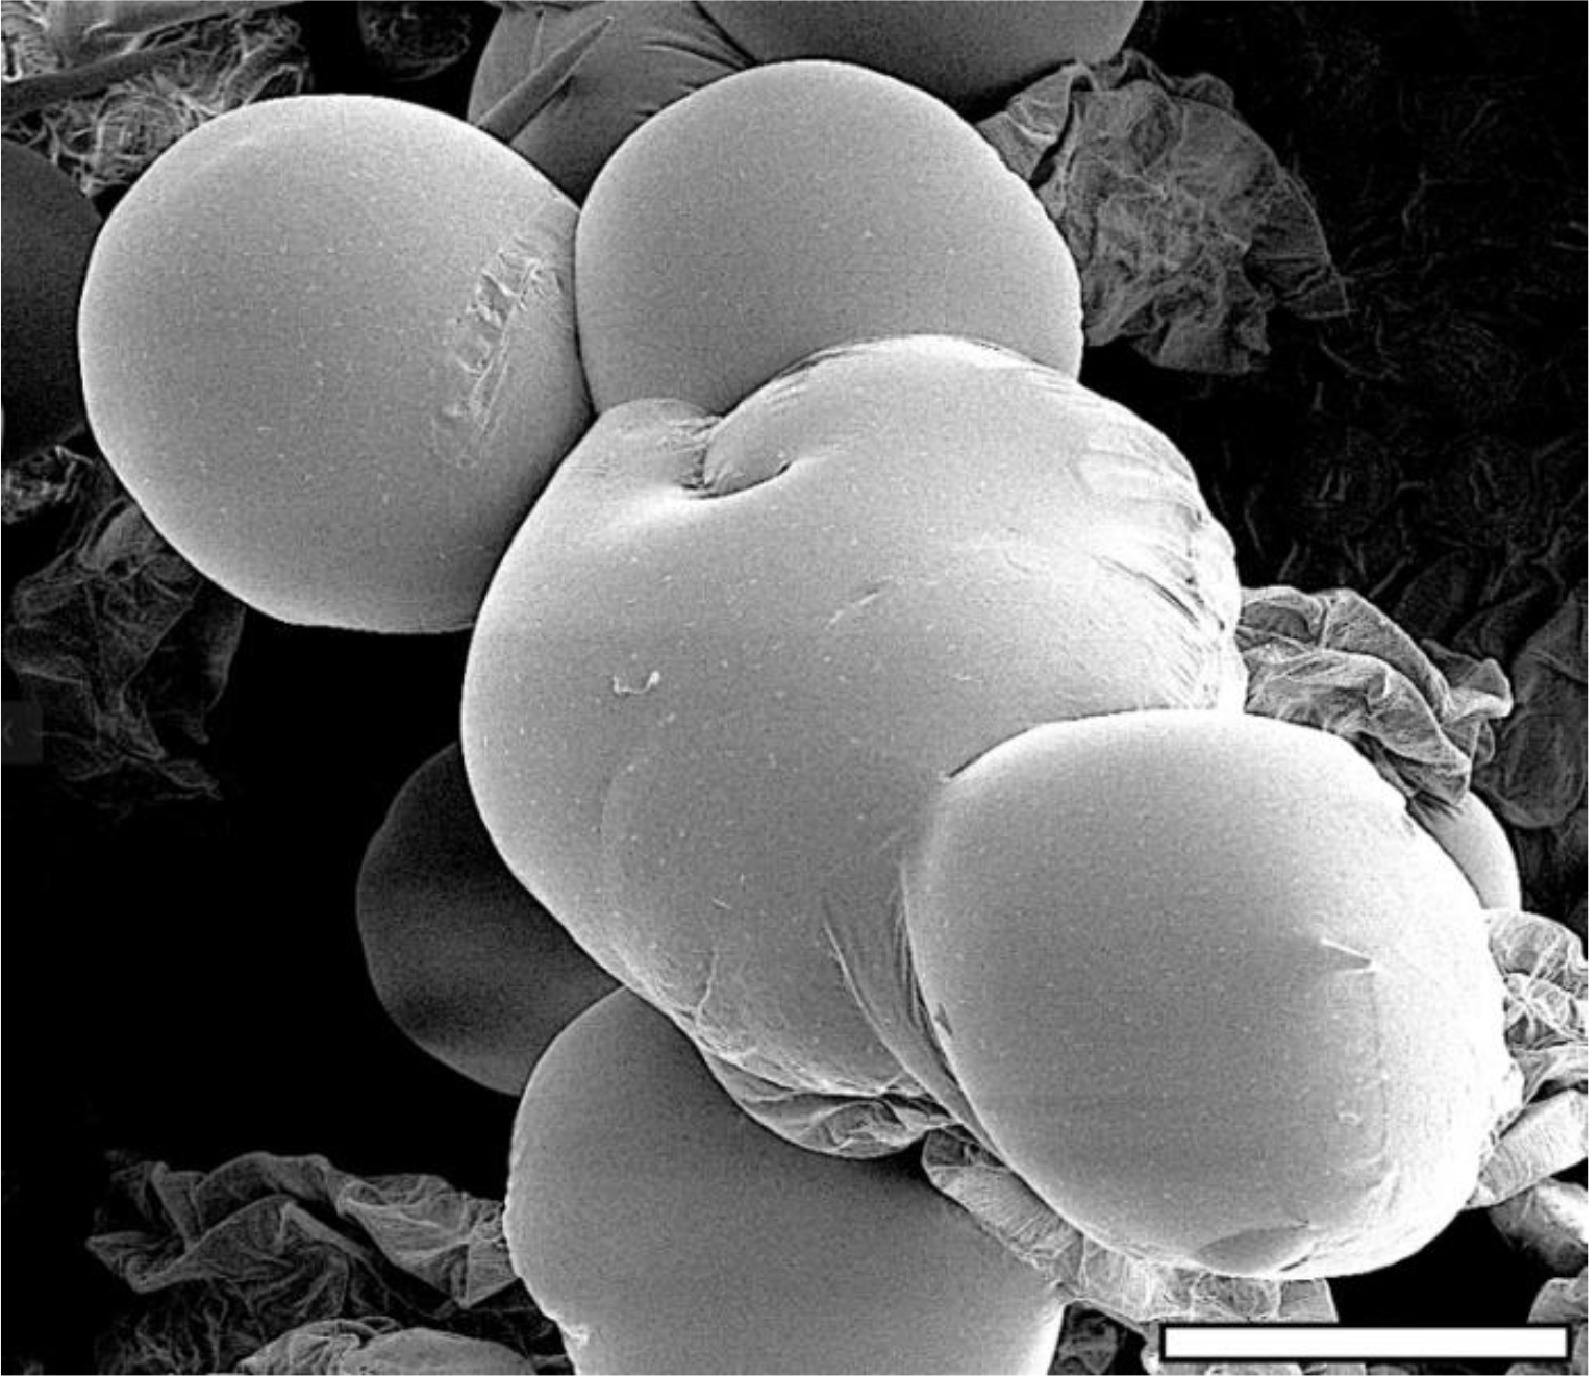
Fig. 13 Scanning electron microscopy image of clumped trichomes. Senescent flower tissue was imaged by cryogenic SEM to observe resin leakage from glands and gland clumping. Scale bar (lower right) represents 50 μm. |
|---|---|
| Source |
Sutton, D.B.; Punja, Z.K.; Hamarneh, G. (2023). "Characterization of trichome phenotypes to assess maturation and flower development in Cannabis sativa L. (cannabis) by automatic trichome gland analysis". Smart Agricultural Technology 3: 100111. doi:10.1016/j.atech.2022.100111. |
| Date |
2023 |
| Author |
Sutton, D.B.; Punja, Z.K.; Hamarneh, G. |
| Permission (Reusing this file) |
Creative Commons Attribution-NonCommercial-NoDerivatives 4.0 International |
| Other versions |
Licensing
|
|
This work is licensed under the Creative Commons Attribution-NonCommercial-NoDerivatives 4.0 International License. |
File history
Click on a date/time to view the file as it appeared at that time.
| Date/Time | Thumbnail | Dimensions | User | Comment | |
|---|---|---|---|---|---|
| current | 17:33, 7 June 2023 | | 1,589 × 1,376 (386 KB) | Shawndouglas (talk | contribs) |
You cannot overwrite this file.
File usage
The following page uses this file: