File:Fig11 Sutton SmartAgTech2023 3.jpg
Original file (3,213 × 814 pixels, file size: 223 KB, MIME type: image/jpeg)
Summary
| Description |
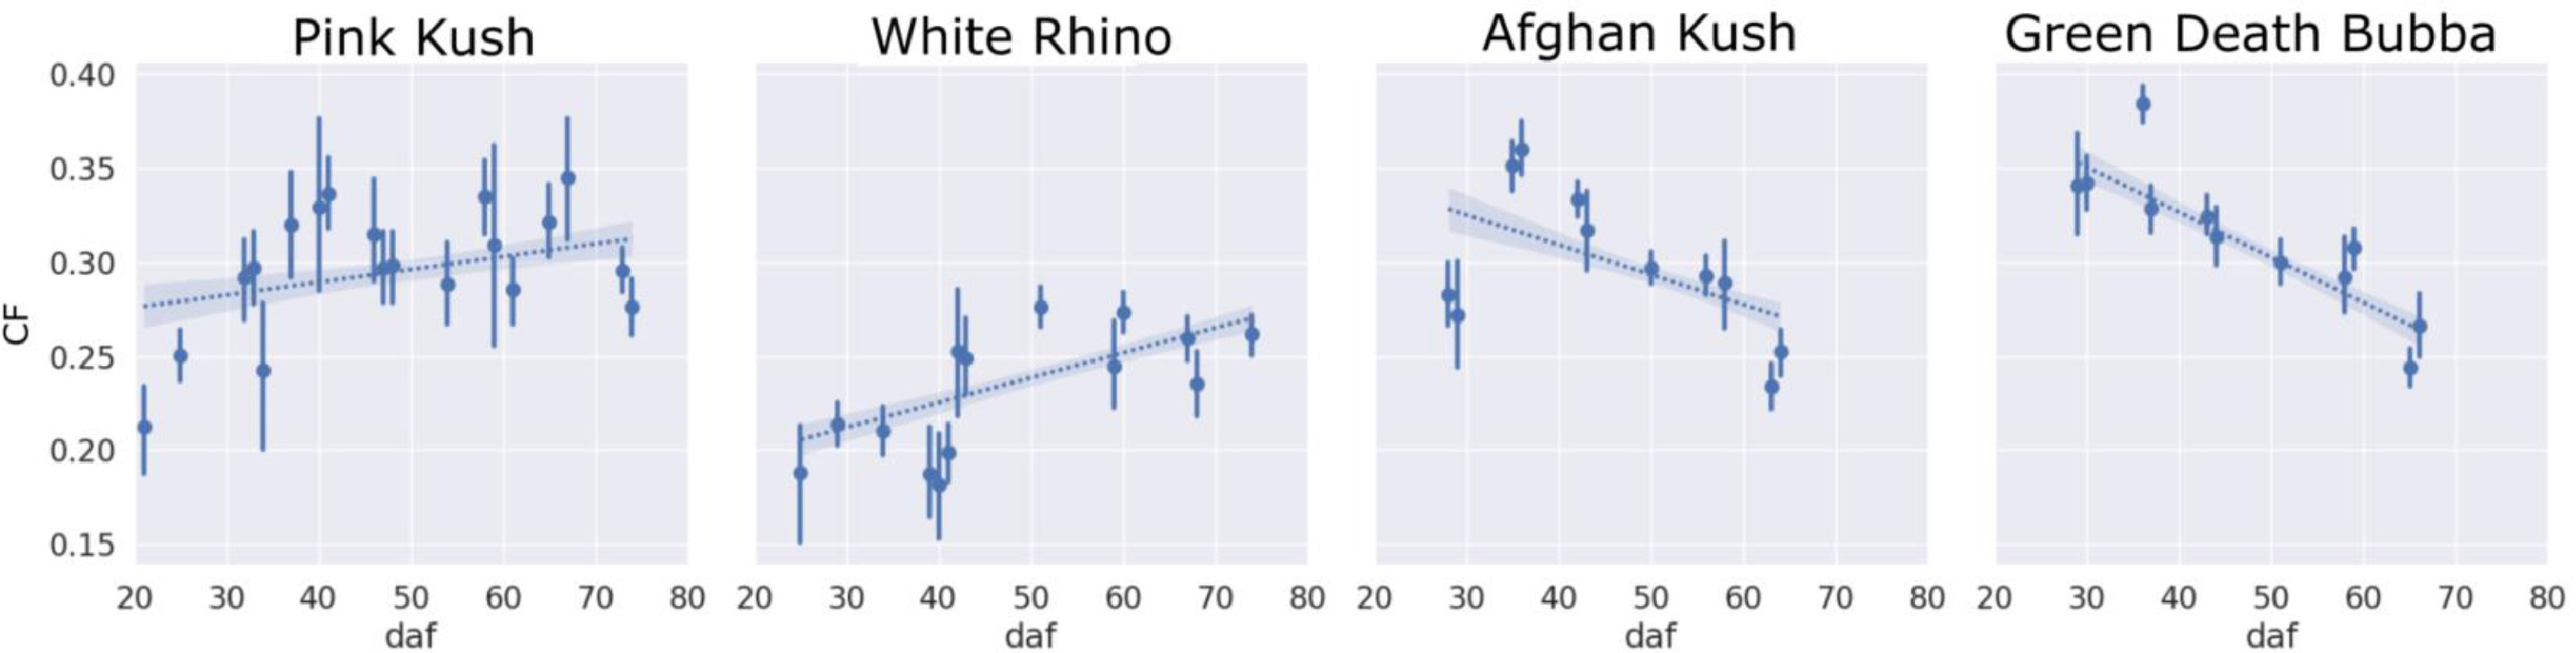
Fig. 11 Clumping fraction (CF). For each photographed bract image, the clumping fraction was computed as the relative difference in detected trichome glands using different connectivity criteria (expressed as ) observed over the flowering period. Points are the mean of all bract tissue samples observed at the specified flowering time, with error bars representing the standard deviation of the mean. Linear regression lines display 95% confidence intervals as transparent bands. |
|---|---|
| Source |
Sutton, D.B.; Punja, Z.K.; Hamarneh, G. (2023). "Characterization of trichome phenotypes to assess maturation and flower development in Cannabis sativa L. (cannabis) by automatic trichome gland analysis". Smart Agricultural Technology 3: 100111. doi:10.1016/j.atech.2022.100111. |
| Date |
2023 |
| Author |
Sutton, D.B.; Punja, Z.K.; Hamarneh, G. |
| Permission (Reusing this file) |
Creative Commons Attribution-NonCommercial-NoDerivatives 4.0 International |
| Other versions |

Licensing
|
|
This work is licensed under the Creative Commons Attribution-NonCommercial-NoDerivatives 4.0 International License. |
File history
Click on a date/time to view the file as it appeared at that time.
| Date/Time | Thumbnail | Dimensions | User | Comment | |
|---|---|---|---|---|---|
| current | 17:27, 7 June 2023 | 3,213 × 814 (223 KB) | Shawndouglas (talk | contribs) |
You cannot overwrite this file.
File usage
The following page uses this file: